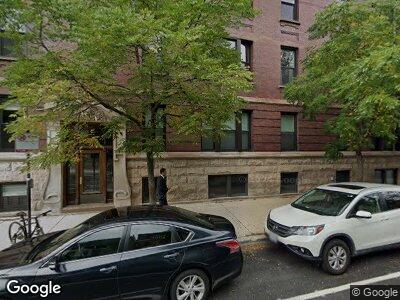
520 W Armitage Ave Unit 5203 Chicago, IL 60614
Lincoln Park NeighborhoodEstimated Value: $395,000 - $507,862
2
Beds
1
Bath
22,618
Sq Ft
$21/Sq Ft
Est. Value
About This Home
This home is located at 520 W Armitage Ave Unit 5203, Chicago, IL 60614 and is currently estimated at $471,216, approximately $20 per square foot. 520 W Armitage Ave Unit 5203 is a home located in Cook County with nearby schools including Abraham Lincoln Elementary School, Lincoln Park High School, and St. James Lutheran School.
Ownership History
Date
Name
Owned For
Owner Type
Purchase Details
Closed on
Jun 29, 2022
Sold by
Diane J Biegert Trust
Bought by
Ferguson Sarah and Melz Adam
Current Estimated Value
Home Financials for this Owner
Home Financials are based on the most recent Mortgage that was taken out on this home.
Original Mortgage
$312,000
Outstanding Balance
$301,209
Interest Rate
5.38%
Mortgage Type
New Conventional
Estimated Equity
$176,433
Purchase Details
Closed on
Jan 6, 2020
Sold by
Biegert Diane J
Bought by
Biegert Diane J and Diane J Biegert Trust
Purchase Details
Closed on
Mar 30, 1994
Sold by
American National Bk & Tr Co Of Chicago
Bought by
Biegert Diane J
Home Financials for this Owner
Home Financials are based on the most recent Mortgage that was taken out on this home.
Original Mortgage
$102,000
Interest Rate
7.17%
Create a Home Valuation Report for This Property
The Home Valuation Report is an in-depth analysis detailing your home's value as well as a comparison with similar homes in the area
Home Values in the Area
Average Home Value in this Area
Purchase History
| Date | Buyer | Sale Price | Title Company |
|---|---|---|---|
| Ferguson Sarah | $393,500 | Chicago Title | |
| Biegert Diane J | -- | Attorney | |
| Biegert Diane J | $108,000 | -- |
Source: Public Records
Mortgage History
| Date | Status | Borrower | Loan Amount |
|---|---|---|---|
| Open | Ferguson Sarah | $312,000 | |
| Previous Owner | Biegert Diane J | $51,000 | |
| Previous Owner | Biegert Diane J | $79,495 | |
| Previous Owner | Biegert Diane J | $89,600 | |
| Previous Owner | Biegert Diane J | $102,000 |
Source: Public Records
Tax History Compared to Growth
Tax History
| Year | Tax Paid | Tax Assessment Tax Assessment Total Assessment is a certain percentage of the fair market value that is determined by local assessors to be the total taxable value of land and additions on the property. | Land | Improvement |
|---|---|---|---|---|
| 2024 | $7,378 | $47,293 | $6,827 | $40,466 |
| 2023 | $7,378 | $39,290 | $5,505 | $33,785 |
| 2022 | $7,378 | $39,290 | $5,505 | $33,785 |
| 2021 | $7,231 | $39,290 | $5,505 | $33,785 |
| 2020 | $7,000 | $34,525 | $4,844 | $29,681 |
| 2019 | $6,845 | $37,498 | $4,844 | $32,654 |
| 2018 | $6,729 | $37,498 | $4,844 | $32,654 |
| 2017 | $6,208 | $32,215 | $3,963 | $28,252 |
| 2016 | $5,952 | $32,215 | $3,963 | $28,252 |
| 2015 | $5,423 | $32,215 | $3,963 | $28,252 |
| 2014 | $5,245 | $30,836 | $2,972 | $27,864 |
| 2013 | $5,130 | $30,836 | $2,972 | $27,864 |
Source: Public Records
Map
Nearby Homes
- 545 W Dickens Ave
- 2054 N Mohawk St
- 1942 N Cleveland Ave
- 2030 N Lincoln Ave Unit AB
- 2034 N Mohawk St Unit 1
- 2046 N Mohawk St
- 2334 N Cleveland Ave
- 1944 N Sedgwick St Unit 2
- 1942 N Sedgwick St Unit PH
- 542 W Dickens Ave
- 2015 N Howe St
- 401 W Dickens Ave
- 2124 N Cleveland Ave
- 2122 N Hudson Ave
- 1921 N Sedgwick St
- 2128 N Hudson Ave Unit 404
- 2020 N Howe St Unit 3S
- 1834 N Hudson Ave Unit 2
- 2035 N Orleans St Unit 2N
- 327 W Armitage Ave Unit 1
- 520 W Armitage Ave Unit 5203
- 520 W Armitage Ave Unit 2
- 520 W Armitage Ave Unit 3
- 518 W Armitage Ave Unit 1
- 518 W Armitage Ave Unit 1W
- 518 W Armitage Ave Unit 5183
- 518 W Armitage Ave Unit 5182
- 518 W Armitage Ave Unit 2
- 516 W Armitage Ave Unit 5161
- 516 W Armitage Ave Unit 5222
- 516 W Armitage Ave Unit 5201
- 516 W Armitage Ave Unit 5181
- 516 W Armitage Ave Unit 5163
- 516 W Armitage Ave Unit 5223
- 516 W Armitage Ave Unit 5202
- 516 W Armitage Ave Unit 5221
- 516 W Armitage Ave Unit 5162
- 516 W Armitage Ave Unit 1
- 516 W Armitage Ave Unit 3
- 2005 N Mohawk St