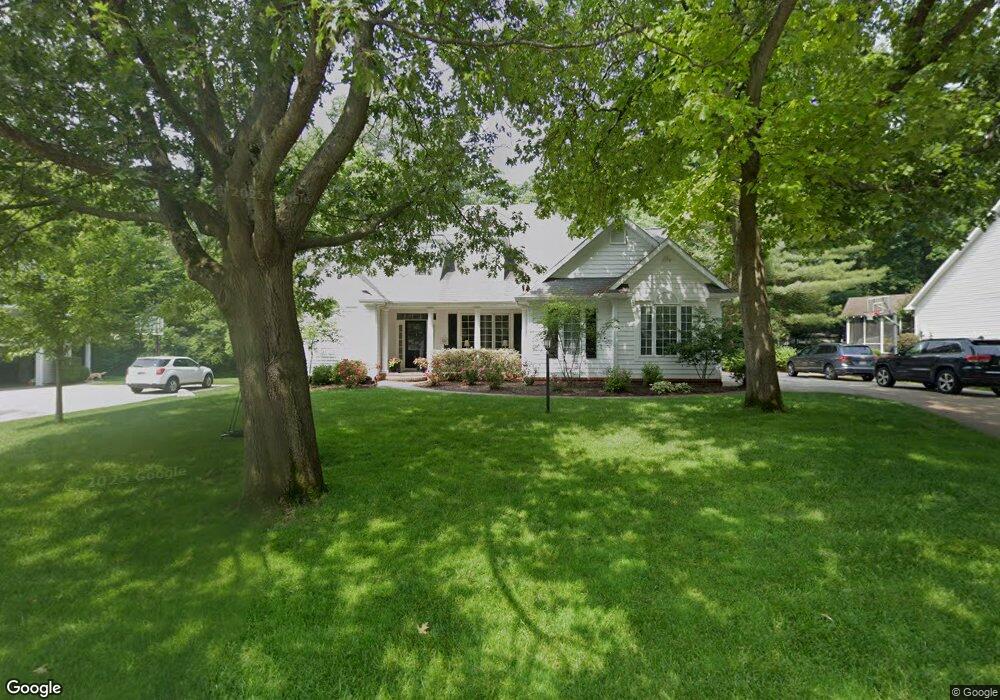
52011 Fall Creek Dr Granger, IN 46530
Estimated Value: $525,975 - $688,000
3
Beds
3
Baths
4,726
Sq Ft
$122/Sq Ft
Est. Value
About This Home
This home is located at 52011 Fall Creek Dr, Granger, IN 46530 and is currently estimated at $577,744, approximately $122 per square foot. 52011 Fall Creek Dr is a home located in St. Joseph County with nearby schools including Clay Intermediate Center, Darden Elementary School, and Edison Middle School.
Ownership History
Date
Name
Owned For
Owner Type
Purchase Details
Closed on
Jul 9, 2010
Sold by
Moran Brian R and Moran Ann A
Bought by
Betz John R and Betz Laura Wells
Current Estimated Value
Home Financials for this Owner
Home Financials are based on the most recent Mortgage that was taken out on this home.
Original Mortgage
$210,000
Outstanding Balance
$138,600
Interest Rate
4.74%
Mortgage Type
New Conventional
Estimated Equity
$439,144
Purchase Details
Closed on
Aug 15, 2006
Sold by
Paul William E
Bought by
Moran Brian R and Moran Ann A
Home Financials for this Owner
Home Financials are based on the most recent Mortgage that was taken out on this home.
Original Mortgage
$291,200
Interest Rate
6.83%
Mortgage Type
New Conventional
Create a Home Valuation Report for This Property
The Home Valuation Report is an in-depth analysis detailing your home's value as well as a comparison with similar homes in the area
Home Values in the Area
Average Home Value in this Area
Purchase History
| Date | Buyer | Sale Price | Title Company |
|---|---|---|---|
| Betz John R | -- | Meridian Title Corp | |
| Moran Brian R | -- | Meridian Title Crop |
Source: Public Records
Mortgage History
| Date | Status | Borrower | Loan Amount |
|---|---|---|---|
| Open | Betz John R | $210,000 | |
| Previous Owner | Moran Brian R | $291,200 |
Source: Public Records
Tax History
| Year | Tax Paid | Tax Assessment Tax Assessment Total Assessment is a certain percentage of the fair market value that is determined by local assessors to be the total taxable value of land and additions on the property. | Land | Improvement |
|---|---|---|---|---|
| 2024 | $5,826 | $490,300 | $114,700 | $375,600 |
| 2023 | $5,715 | $495,800 | $114,700 | $381,100 |
| 2022 | $6,174 | $500,300 | $114,700 | $385,600 |
| 2021 | $4,175 | $337,700 | $36,000 | $301,700 |
| 2020 | $3,685 | $298,900 | $31,600 | $267,300 |
| 2019 | $3,051 | $300,300 | $30,000 | $270,300 |
| 2018 | $3,420 | $296,000 | $29,000 | $267,000 |
| 2017 | $2,870 | $244,700 | $12,100 | $232,600 |
| 2016 | $3,094 | $255,000 | $19,800 | $235,200 |
| 2014 | $3,187 | $257,500 | $19,800 | $237,700 |
Source: Public Records
Map
Nearby Homes
- 52191 Carriage Hills Dr
- 51907 Carriage Hills Dr
- 51725 Villager Pkwy
- 18157 Windmill Ct
- 18193 Windmill Ct
- 51527 Summer Hill Dr
- 17930 Bay Hill Dr
- 51757 Hickory Rd Unit 2
- 52836 Arbor Dr
- 52175 Avanelle St
- 18180 Amberly Ln
- 51793 Heath Ct
- 52145 Brookview Ct
- 51824 Wembley Dr
- 16947 Woodland Hills Dr S
- 17498 Cleveland Rd
- 52150 Tammy Dr
- 16874 Hidden Valley Dr
- 52625 & 52637 Emmons Rd
- TBD Emmons Rd
- 51991 Fall Creek Dr
- 17646 Woodridge Ct
- 52004 Fall Creek Dr
- 52024 Fall Creek Dr
- 17633 Hansom Ct
- 17631 Woodridge Ct
- 51982 Fall Creek Dr
- 51973 Fall Creek Dr
- 17645 Hansom Ct
- 52043 Fall Creek Dr
- 52050 Fall Creek Dr
- 17662 Woodridge Ct
- 51962 Fall Creek Dr
- 52035 Iron Forge Ct
- 51952 Fall Creek Dr
- 17647 Woodridge Ct
- 52063 Fall Creek Dr
- 17640 Hansom Ct
- 17663 Hansom Ct
- 52051 Iron Forge Ct
Your Personal Tour Guide
Ask me questions while you tour the home.