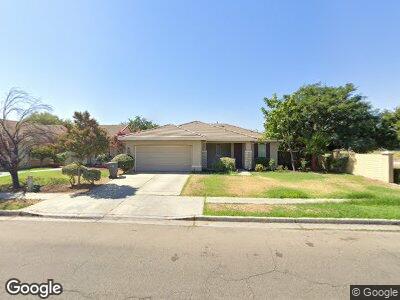
5202 E Grove Ave Fresno, CA 93725
Cecile NeighborhoodEstimated Value: $376,774 - $431,000
3
Beds
2
Baths
1,432
Sq Ft
$283/Sq Ft
Est. Value
About This Home
This home is located at 5202 E Grove Ave, Fresno, CA 93725 and is currently estimated at $404,694, approximately $282 per square foot. 5202 E Grove Ave is a home located in Fresno County with nearby schools including Edith B. Storey Elementary School, Elizabeth Terronez Middle School, and Sunnyside High School.
Ownership History
Date
Name
Owned For
Owner Type
Purchase Details
Closed on
Jan 5, 2011
Sold by
Federal National Mortgage Association
Bought by
Mejorado Stephanie
Current Estimated Value
Home Financials for this Owner
Home Financials are based on the most recent Mortgage that was taken out on this home.
Original Mortgage
$130,603
Interest Rate
4.96%
Mortgage Type
FHA
Purchase Details
Closed on
Aug 27, 2010
Sold by
Allensworth Gene E
Bought by
Federal National Mortgage Association
Purchase Details
Closed on
Aug 17, 2007
Sold by
Hardy Ray and Hardy Rachelle
Bought by
Hardy Ray L and Hardy Rachelle L
Purchase Details
Closed on
Nov 16, 2006
Sold by
Beazer Homes Holdings Corp
Bought by
Allensworth Gene E
Home Financials for this Owner
Home Financials are based on the most recent Mortgage that was taken out on this home.
Original Mortgage
$189,000
Interest Rate
6.29%
Mortgage Type
Purchase Money Mortgage
Create a Home Valuation Report for This Property
The Home Valuation Report is an in-depth analysis detailing your home's value as well as a comparison with similar homes in the area
Home Values in the Area
Average Home Value in this Area
Purchase History
| Date | Buyer | Sale Price | Title Company |
|---|---|---|---|
| Mejorado Stephanie | $134,000 | First American Title Ins Co | |
| Federal National Mortgage Association | $161,184 | None Available | |
| Hardy Ray L | -- | None Available | |
| Allensworth Gene E | $210,000 | Chicago Title Company |
Source: Public Records
Mortgage History
| Date | Status | Borrower | Loan Amount |
|---|---|---|---|
| Previous Owner | Mejorado Stephanie | $130,603 | |
| Previous Owner | Allensworth Gene E | $193,000 | |
| Previous Owner | Allensworth Gene E | $189,000 |
Source: Public Records
Tax History Compared to Growth
Tax History
| Year | Tax Paid | Tax Assessment Tax Assessment Total Assessment is a certain percentage of the fair market value that is determined by local assessors to be the total taxable value of land and additions on the property. | Land | Improvement |
|---|---|---|---|---|
| 2023 | $2,242 | $165,002 | $61,566 | $103,436 |
| 2022 | $2,202 | $161,767 | $60,359 | $101,408 |
| 2021 | $2,140 | $158,596 | $59,176 | $99,420 |
| 2020 | $2,124 | $156,971 | $58,570 | $98,401 |
| 2019 | $2,042 | $153,894 | $57,422 | $96,472 |
| 2018 | $2,005 | $150,878 | $56,297 | $94,581 |
| 2017 | $1,944 | $147,921 | $55,194 | $92,727 |
| 2016 | $1,888 | $145,021 | $54,112 | $90,909 |
| 2015 | $2,132 | $142,844 | $53,300 | $89,544 |
| 2014 | $2,199 | $140,046 | $52,256 | $87,790 |
Source: Public Records
Map
Nearby Homes
- 5266 E Harvest Ln
- 5275 E Hoxie Ave
- 5254 E Jensen Ave
- 5140 E Belgravia Ave
- 2575 S Willow Ave Unit 118
- 2575 S Willow Ave Unit 165
- 2575 S Willow Ave Unit 156
- 2575 S Willow Ave Unit 46
- 2575 S Willow Ave Unit 164
- 2575 S Willow Ave Unit 167
- 5357 E Burns Ave
- 5375 E Eugenia Ave
- 2449 S Willow Ave
- 5157 E Truman Ave
- 0 Sec- Willow & Church Ave Unit 625604
- 5160 E Florence Ave
- 5140 E Florence Ave
- 5112 E Florence Ave
- 2194 S Sylmar Ave
- 2173 S Sylmar Ave
- 5202 E Grove Ave
- 5206 E Grove Ave
- 5210 E Grove Ave
- 5213 E Byrd Ave
- 5206 E Wildflower Ln
- 2516 S Adrian Ave
- 5210 E Wildflower Ln
- 5214 E Grove Ave
- 5217 E Byrd Ave
- 2490 S Lemonwood Ln
- 5216 E Wildflower Ln
- 5221 E Byrd Ave
- 5218 E Grove Ave
- 2520 S Adrian Ave
- 2484 S Lemonwood Ln
- 2485 S Lemonwood Ln
- 5225 E Byrd Ave
- 5222 E Grove Ave
- 5218 E Byrd Ave
- 2484 S Summerfield Ln