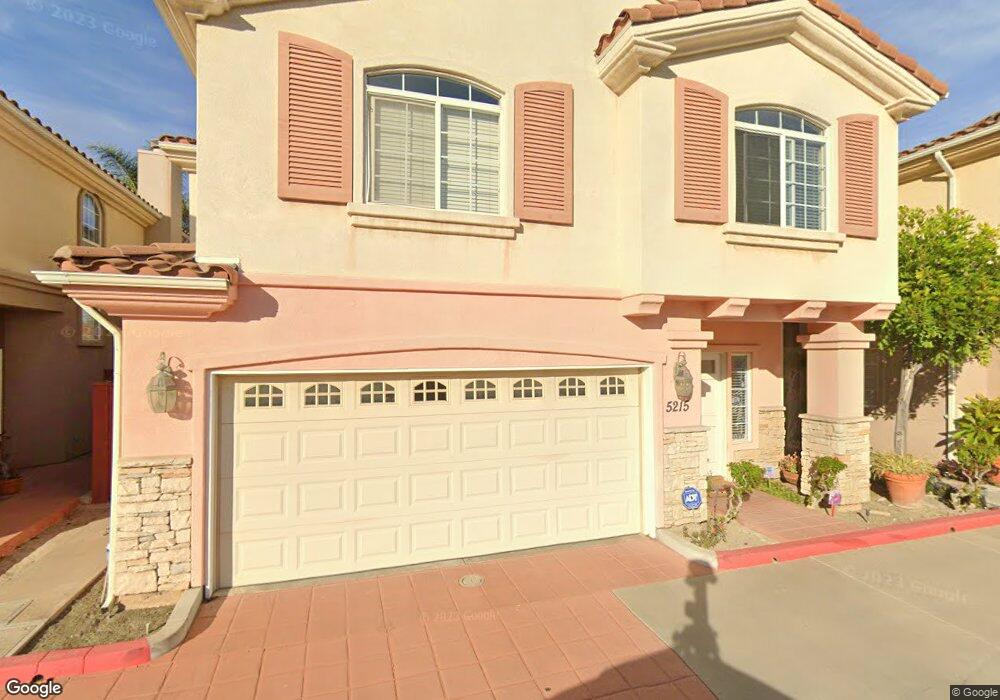
5205 Cherwell Way Cypress, CA 90630
Estimated Value: $858,000 - $1,260,000
5
Beds
3
Baths
2,115
Sq Ft
$486/Sq Ft
Est. Value
About This Home
This home is located at 5205 Cherwell Way, Cypress, CA 90630 and is currently estimated at $1,028,947, approximately $486 per square foot. 5205 Cherwell Way is a home located in Orange County with nearby schools including Clara J. King Elementary School, Lexington Junior High School, and Cypress High School.
Ownership History
Date
Name
Owned For
Owner Type
Purchase Details
Closed on
Dec 29, 2016
Sold by
Byun So Ok
Bought by
Byun Chang Up and Byun So Ok
Current Estimated Value
Purchase Details
Closed on
Dec 8, 2004
Sold by
Byeon Song Deok
Bought by
Byun So Ok
Home Financials for this Owner
Home Financials are based on the most recent Mortgage that was taken out on this home.
Original Mortgage
$135,000
Interest Rate
5.64%
Mortgage Type
Credit Line Revolving
Purchase Details
Closed on
May 26, 2004
Sold by
Byun Chang Up
Bought by
Byun So Ok
Purchase Details
Closed on
Mar 19, 2004
Sold by
Oxford Court Ii Llc
Bought by
Byun So Ok
Home Financials for this Owner
Home Financials are based on the most recent Mortgage that was taken out on this home.
Original Mortgage
$470,000
Interest Rate
6.5%
Mortgage Type
Purchase Money Mortgage
Create a Home Valuation Report for This Property
The Home Valuation Report is an in-depth analysis detailing your home's value as well as a comparison with similar homes in the area
Home Values in the Area
Average Home Value in this Area
Purchase History
| Date | Buyer | Sale Price | Title Company |
|---|---|---|---|
| Byun Chang Up | -- | None Available | |
| Byun So Ok | -- | -- | |
| Byun So Ok | -- | First American Title Company | |
| Byun So Ok | $587,500 | First American Title Company |
Source: Public Records
Mortgage History
| Date | Status | Borrower | Loan Amount |
|---|---|---|---|
| Previous Owner | Byun So Ok | $135,000 | |
| Previous Owner | Byun So Ok | $470,000 | |
| Closed | Byun So Ok | $100,000 |
Source: Public Records
Tax History Compared to Growth
Tax History
| Year | Tax Paid | Tax Assessment Tax Assessment Total Assessment is a certain percentage of the fair market value that is determined by local assessors to be the total taxable value of land and additions on the property. | Land | Improvement |
|---|---|---|---|---|
| 2025 | $9,279 | $835,294 | $564,596 | $270,698 |
| 2024 | $9,279 | $818,916 | $553,525 | $265,391 |
| 2023 | $8,217 | $724,118 | $509,703 | $214,415 |
| 2022 | $8,125 | $709,920 | $499,709 | $210,211 |
| 2021 | $8,020 | $696,000 | $489,910 | $206,090 |
| 2020 | $7,337 | $630,000 | $423,910 | $206,090 |
| 2019 | $7,264 | $630,000 | $423,910 | $206,090 |
| 2018 | $6,763 | $581,000 | $374,910 | $206,090 |
| 2017 | $6,654 | $581,000 | $374,910 | $206,090 |
| 2016 | $6,191 | $532,429 | $326,339 | $206,090 |
| 2015 | $6,236 | $532,429 | $326,339 | $206,090 |
| 2014 | $5,903 | $522,000 | $319,947 | $202,053 |
Source: Public Records
Map
Nearby Homes
- 9011 Cerise Ln Unit 121
- 9011 Cerise Ln
- 9011 Cerise Ln Unit 122
- 9001 Cerise Ln Unit 109
- 9001 Cerise Ln Unit 113
- Plan B1X at Citrus Square - Cerise
- Plan B1 at Citrus Square - Cerise
- Plan A1 at Citrus Square - Cerise
- Plan A2 at Citrus Square - Cerise
- 5275 Vista Real
- 9574 Tivoli Cir
- 9565 Graham St
- 9678 Walker Ct
- 4790 Montefino Dr
- 4823 Fieldbrook Ln Unit 24
- 4819 Fieldbrook Ln
- 4617 Alekona Ct
- 4644 Portofino Cir
- 5493 Twin Lakes Dr
- 5041 Myra Ave
- 5215 Cherwell Way
- 5225 Cherwell Way
- 5225 Cherwell Ln
- 9463 Cherwell Ln
- 9463 Cherwell Ln Unit 6
- 5218 Sowma Way
- 5208 Sowma Way
- 9462 Cherwell Ct Unit 3
- 9468 Cherwell Ln
- 5228 Sowma Way
- 9473 Cherwell Ln
- 5198 Sowma Way
- 9472 Cherwell Ct Unit 2
- 9478 Cherwell Ln
- 5175 Cherwell Way
- 5175 Cherwell Way
- 5185 Cherwell Way Unit 5
- 5195 Cherwell Way
- 9461 Cherwell Ct Unit 7
- 9483 Cherwell Ln Unit 8