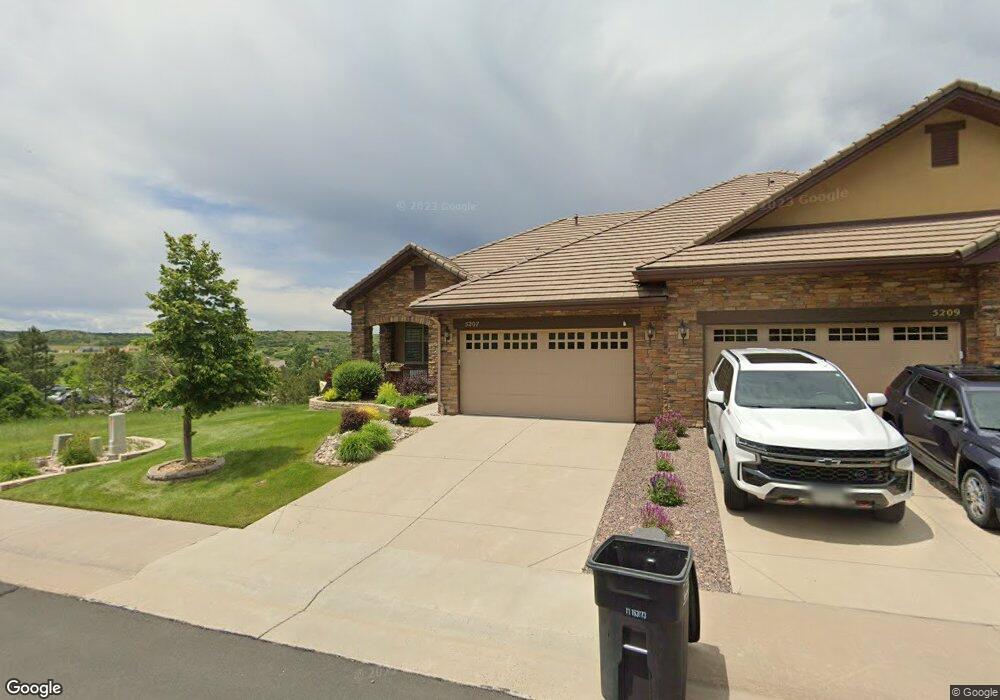
5207 Colina Place Parker, CO 80134
The Pinery NeighborhoodEstimated Value: $814,613 - $1,136,000
1
Bed
2
Baths
1,647
Sq Ft
$568/Sq Ft
Est. Value
About This Home
This home is located at 5207 Colina Place, Parker, CO 80134 and is currently estimated at $935,653, approximately $568 per square foot. 5207 Colina Place is a home located in Douglas County with nearby schools including Mountain View Elementary School, Northeast Elementary School, and Sagewood Middle School.
Ownership History
Date
Name
Owned For
Owner Type
Purchase Details
Closed on
Jun 3, 2025
Sold by
Person Mark and Person Patricia
Bought by
Pfp And Mdp Living Trust
Current Estimated Value
Purchase Details
Closed on
Mar 6, 2020
Sold by
Novosel Patricia
Bought by
Person Patricia F and Person Mark D
Purchase Details
Closed on
Mar 1, 2017
Sold by
Novosel Patricia F
Bought by
Novosel Patricia F and Person Mark Douglas
Purchase Details
Closed on
Oct 29, 2010
Sold by
Novosel Thomas C
Bought by
Novosel Patricia F
Purchase Details
Closed on
Oct 1, 2010
Sold by
Novosel Thomas C
Bought by
Novosel Patricia F
Purchase Details
Closed on
Jan 18, 2008
Sold by
Kdb Homes Inc
Bought by
Novosel Thomas C and Novosel Patricia F
Home Financials for this Owner
Home Financials are based on the most recent Mortgage that was taken out on this home.
Original Mortgage
$400,000
Interest Rate
5.94%
Mortgage Type
Unknown
Create a Home Valuation Report for This Property
The Home Valuation Report is an in-depth analysis detailing your home's value as well as a comparison with similar homes in the area
Home Values in the Area
Average Home Value in this Area
Purchase History
| Date | Buyer | Sale Price | Title Company |
|---|---|---|---|
| Pfp And Mdp Living Trust | -- | None Listed On Document | |
| Person Patricia F | -- | None Available | |
| Novosel Patricia F | -- | None Available | |
| Novosel Patricia F | -- | -- | |
| Novosel Patricia F | -- | Fidelity National Title Insu | |
| Novosel Thomas C | $500,000 | Fahtco |
Source: Public Records
Mortgage History
| Date | Status | Borrower | Loan Amount |
|---|---|---|---|
| Previous Owner | Novosel Thomas C | $400,000 |
Source: Public Records
Tax History Compared to Growth
Tax History
| Year | Tax Paid | Tax Assessment Tax Assessment Total Assessment is a certain percentage of the fair market value that is determined by local assessors to be the total taxable value of land and additions on the property. | Land | Improvement |
|---|---|---|---|---|
| 2024 | $5,661 | $56,380 | $8,800 | $47,580 |
| 2023 | $5,795 | $56,380 | $8,800 | $47,580 |
| 2022 | $5,436 | $39,330 | $6,040 | $33,290 |
| 2021 | $5,476 | $39,330 | $6,040 | $33,290 |
| 2020 | $5,544 | $40,830 | $7,450 | $33,380 |
| 2019 | $5,561 | $40,830 | $7,450 | $33,380 |
| 2018 | $5,165 | $37,550 | $5,830 | $31,720 |
| 2017 | $4,930 | $37,550 | $5,830 | $31,720 |
| 2016 | $4,844 | $35,720 | $5,250 | $30,470 |
| 2015 | $5,089 | $35,720 | $5,250 | $30,470 |
| 2014 | $4,530 | $30,510 | $4,780 | $25,730 |
Source: Public Records
Map
Nearby Homes
- 5526 Twilight Way
- 5334 Sedona Dr
- 4586 Carefree Trail
- 4823 Craftsman Dr
- 5349 Rustler Trail
- 5625 Twilight Way
- 4880 Crescent Moon Place
- 4780 Nighthorse Ct
- 5665 Vistancia Ct
- 4700 Carefree Trail
- 5608 Raintree Dr
- 5387 Spur Cross Trail
- 5440 Spur Cross Trail
- 5672 Vistancia Ct
- Plan Seven: Two-Story at Pradera - The Heritage Series
- Plan One: Ranch at Pradera - The Heritage Series
- Plan Four: Two-Story at Pradera - The Heritage Series
- Plan Two: Two-Story at Pradera - The Heritage Series
- Plan Five: Ranch at Pradera - The Heritage Series
- Modern Custom Plan: Two Story at Pradera - The Custom Collection
- 5209 Colina Place
- 5245 Colina Place
- 5247 Colina Place
- 5212 Colina Place
- 5250 Colina Place
- 5272 Rialto Dr
- 5214 Colina Place
- 5283 Colina Place
- 5252 Colina Place
- 5285 Colina Place
- 5286 Colina Place
- 5270 Rialto Dr
- 5288 Colina Place
- 5309 Colina Place
- 5311 Colina Place
- 5312 Colina Place
- 5331 Talavero Place
- 5314 Colina Place
- 5365 Colina Place
- 5189 Sedona Dr