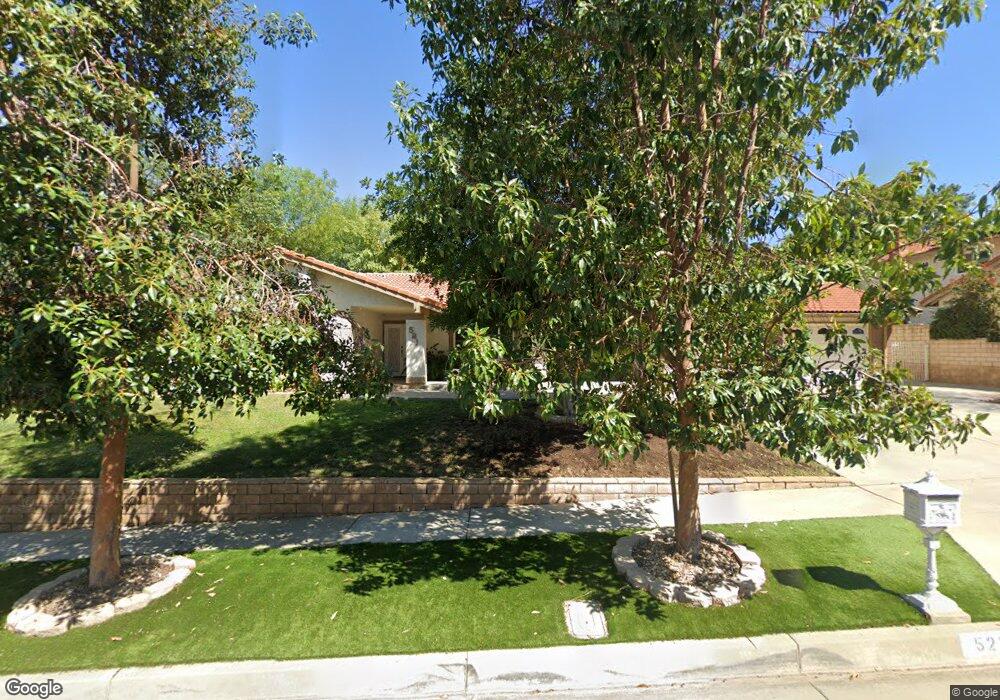
521 Clover St Redlands, CA 92373
South Redlands NeighborhoodEstimated Value: $698,752 - $889,000
4
Beds
2
Baths
2,138
Sq Ft
$365/Sq Ft
Est. Value
About This Home
This home is located at 521 Clover St, Redlands, CA 92373 and is currently estimated at $780,688, approximately $365 per square foot. 521 Clover St is a home located in San Bernardino County with nearby schools including Smiley Elementary School, Cope Middle School, and Redlands Senior High School.
Ownership History
Date
Name
Owned For
Owner Type
Purchase Details
Closed on
Oct 22, 2001
Sold by
Rold Vicki Rae
Bought by
Johnson Wayne L and Dunithan Geraldine M
Current Estimated Value
Home Financials for this Owner
Home Financials are based on the most recent Mortgage that was taken out on this home.
Original Mortgage
$130,000
Interest Rate
5.75%
Mortgage Type
New Conventional
Purchase Details
Closed on
Jul 29, 1996
Sold by
Altes Ray D and Altes Florence G
Bought by
Altes Ray D and Altes Florence G
Create a Home Valuation Report for This Property
The Home Valuation Report is an in-depth analysis detailing your home's value as well as a comparison with similar homes in the area
Home Values in the Area
Average Home Value in this Area
Purchase History
| Date | Buyer | Sale Price | Title Company |
|---|---|---|---|
| Johnson Wayne L | $190,000 | Fidelity National Title Ins | |
| Altes Ray D | -- | -- |
Source: Public Records
Mortgage History
| Date | Status | Borrower | Loan Amount |
|---|---|---|---|
| Previous Owner | Johnson Wayne L | $130,000 |
Source: Public Records
Tax History
| Year | Tax Paid | Tax Assessment Tax Assessment Total Assessment is a certain percentage of the fair market value that is determined by local assessors to be the total taxable value of land and additions on the property. | Land | Improvement |
|---|---|---|---|---|
| 2025 | $3,424 | $280,691 | $70,173 | $210,518 |
| 2024 | $3,196 | $275,187 | $68,797 | $206,390 |
| 2023 | $3,191 | $269,791 | $67,448 | $202,343 |
| 2022 | $3,143 | $264,500 | $66,125 | $198,375 |
| 2021 | $3,199 | $259,313 | $64,828 | $194,485 |
| 2020 | $4,496 | $256,654 | $64,163 | $192,491 |
| 2019 | $3,061 | $251,622 | $62,905 | $188,717 |
| 2018 | $2,983 | $246,689 | $61,672 | $185,017 |
| 2017 | $2,957 | $241,852 | $60,463 | $181,389 |
| 2016 | $2,922 | $237,109 | $59,277 | $177,832 |
| 2015 | $2,899 | $233,548 | $58,387 | $175,161 |
| 2014 | $2,845 | $228,973 | $57,243 | $171,730 |
Source: Public Records
Map
Nearby Homes
- 1235 W Cypress Ave
- 1324 W Fern Ave
- 726 Robinhood Ln
- 215 San Rafael St
- 1230 San Pablo Ave
- 571 Wooden Bridge Ln
- 608 Monterey St
- 616 Monterey St
- 1522 Blossom Ct
- 1421 Magnolia Ave
- 1033 W Palm Ave
- 1029 W Palm Ave
- 1205 W Highland Ave
- 11891 San Timoteo Canyon Rd
- 31615 Live Oak Canyon Rd
- 1221 San Jacinto St
- 975 Brookside Ave
- 716 W Olive Ave
- 1117 W Crescent Ave
- 622 Esther Way