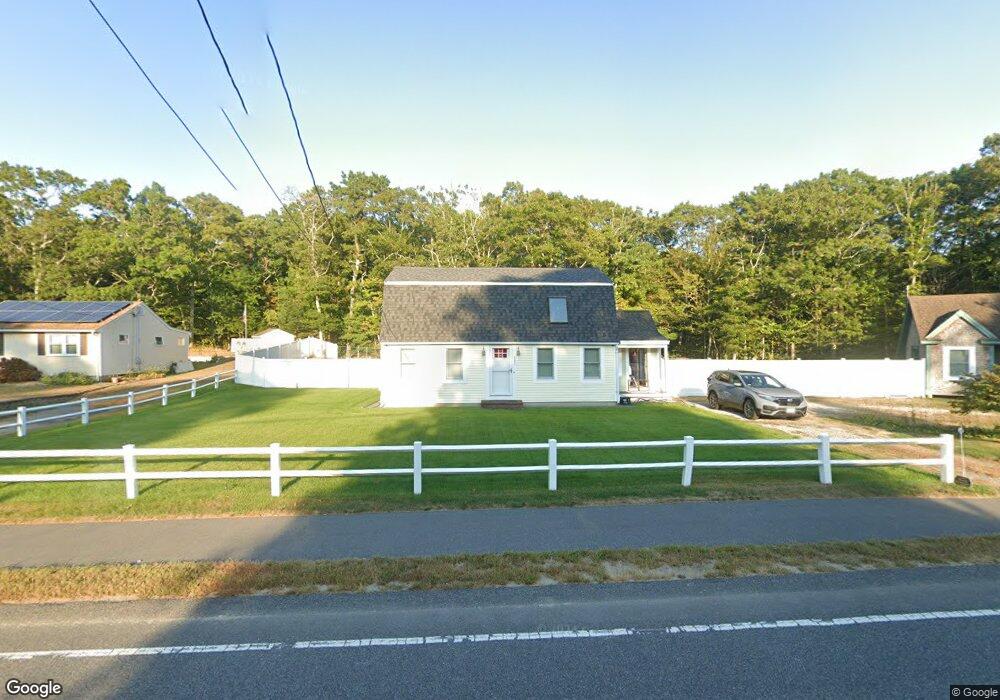
521 Cotuit Rd Mashpee, MA 02649
Estimated Value: $541,000 - $623,000
3
Beds
2
Baths
1,536
Sq Ft
$376/Sq Ft
Est. Value
About This Home
This home is located at 521 Cotuit Rd, Mashpee, MA 02649 and is currently estimated at $576,928, approximately $375 per square foot. 521 Cotuit Rd is a home located in Barnstable County with nearby schools including Kenneth C. Coombs School, Quashnet School, and Mashpee Middle School.
Ownership History
Date
Name
Owned For
Owner Type
Purchase Details
Closed on
Oct 27, 2011
Sold by
Cleary Michael C and Cleary Jennifer A
Bought by
Chiodo Nicholas S and Jones Amanda L
Current Estimated Value
Home Financials for this Owner
Home Financials are based on the most recent Mortgage that was taken out on this home.
Original Mortgage
$223,155
Outstanding Balance
$152,830
Interest Rate
4.11%
Mortgage Type
Purchase Money Mortgage
Estimated Equity
$424,098
Purchase Details
Closed on
Mar 28, 2003
Sold by
Fletcher Robert S and Fletcher Janet L
Bought by
Cleary Michael C and Cleary Jennifer A
Home Financials for this Owner
Home Financials are based on the most recent Mortgage that was taken out on this home.
Original Mortgage
$194,750
Interest Rate
5.91%
Mortgage Type
Purchase Money Mortgage
Purchase Details
Closed on
Nov 16, 1992
Sold by
Johnson Helen R
Bought by
Fletcher Jerome H
Create a Home Valuation Report for This Property
The Home Valuation Report is an in-depth analysis detailing your home's value as well as a comparison with similar homes in the area
Purchase History
| Date | Buyer | Sale Price | Title Company |
|---|---|---|---|
| Chiodo Nicholas S | $234,900 | -- | |
| Cleary Michael C | $205,000 | -- | |
| Fletcher Jerome H | $80,000 | -- |
Source: Public Records
Mortgage History
| Date | Status | Borrower | Loan Amount |
|---|---|---|---|
| Open | Chiodo Nicholas S | $223,155 | |
| Previous Owner | Fletcher Jerome H | $194,750 | |
| Previous Owner | Fletcher Jerome H | $121,000 | |
| Previous Owner | Fletcher Jerome H | $123,750 |
Source: Public Records
Tax History
| Year | Tax Paid | Tax Assessment Tax Assessment Total Assessment is a certain percentage of the fair market value that is determined by local assessors to be the total taxable value of land and additions on the property. | Land | Improvement |
|---|---|---|---|---|
| 2025 | $2,985 | $450,900 | $171,000 | $279,900 |
| 2024 | $2,715 | $422,200 | $155,500 | $266,700 |
| 2023 | $2,444 | $348,700 | $148,000 | $200,700 |
| 2022 | $2,435 | $298,000 | $133,700 | $164,300 |
| 2021 | $2,400 | $264,600 | $120,500 | $144,100 |
| 2020 | $2,297 | $252,700 | $115,900 | $136,800 |
| 2019 | $2,198 | $242,900 | $115,900 | $127,000 |
| 2018 | $2,107 | $236,200 | $115,900 | $120,300 |
| 2017 | $2,071 | $225,300 | $115,900 | $109,400 |
| 2016 | $2,012 | $217,800 | $115,900 | $101,900 |
| 2015 | $1,935 | $212,400 | $115,900 | $96,500 |
| 2014 | $1,900 | $202,300 | $114,400 | $87,900 |
Source: Public Records
Map
Nearby Homes
- 544 Cotuit Rd
- 10 Candlewood Ln
- 45 Fox Hill Rd
- 5 Widow Coombs Walk
- 75 Edgewater Rd
- 24 Widow Coombs Walk
- 63 Deer Ridge Rd
- 20 Lakewood Dr
- 45 Pequot Rd
- 36 Moon Compass Ln
- 290 Main St
- 235 Main St
- 111 Reflection Dr
- 48 Holly Ridge Dr
- 173 Main St
- 9 Viking Ln
- 52 Old Colony Dr
- 170 Forest Hills Rd
- 78 Brittany Dr
- 35 Claulise Ln
Your Personal Tour Guide
Ask me questions while you tour the home.