Estimated Value: $502,000 - $563,000
3
Beds
2
Baths
900
Sq Ft
$583/Sq Ft
Est. Value
About This Home
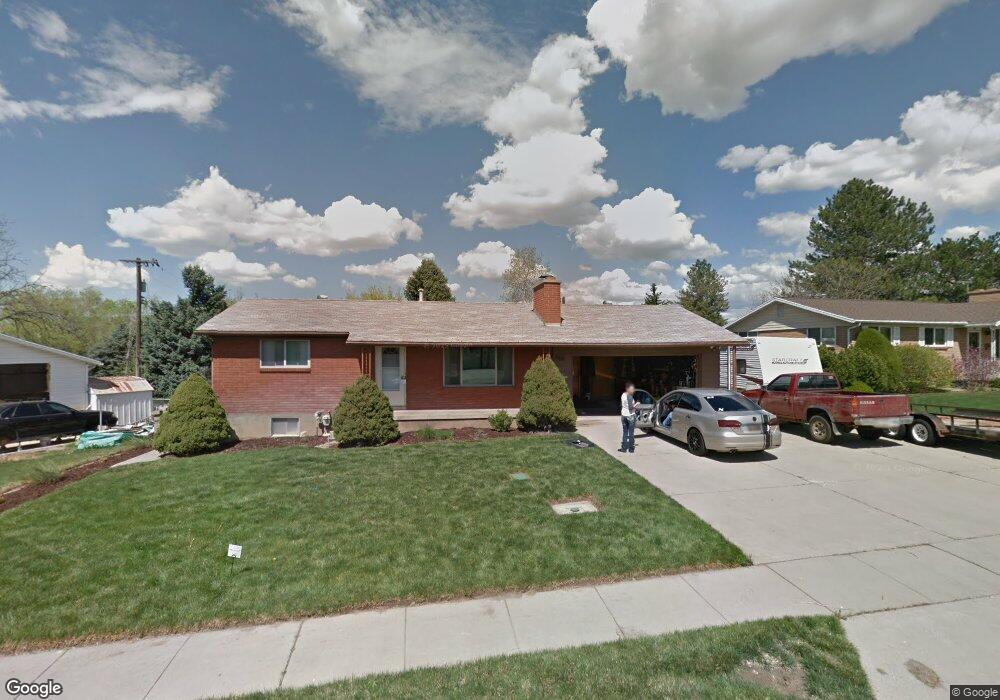
This home is located at 521 E 8045 S, Sandy, UT 84070 and is currently estimated at $524,400, approximately $582 per square foot. 521 E 8045 S is a home located in Salt Lake County with nearby schools including Midvalley Elementary School, Union Middle School, and Hillcrest High School.
Ownership History
Date
Name
Owned For
Owner Type
Purchase Details
Closed on
Jun 10, 2016
Sold by
Jensen Caryl A
Bought by
Jensen Alan Nathan and Jensen Kerianna J
Current Estimated Value
Home Financials for this Owner
Home Financials are based on the most recent Mortgage that was taken out on this home.
Original Mortgage
$216,930
Outstanding Balance
$173,157
Interest Rate
3.66%
Mortgage Type
VA
Estimated Equity
$351,243
Purchase Details
Closed on
Aug 17, 2006
Sold by
Jackman Colleen J
Bought by
Jackman Colleen J and Jensen Caryl A
Create a Home Valuation Report for This Property
The Home Valuation Report is an in-depth analysis detailing your home's value as well as a comparison with similar homes in the area
Home Values in the Area
Average Home Value in this Area
Purchase History
| Date | Buyer | Sale Price | Title Company |
|---|---|---|---|
| Jensen Alan Nathan | -- | Eagle Gate Title Ins Agency | |
| Jackman Colleen J | -- | None Available |
Source: Public Records
Mortgage History
| Date | Status | Borrower | Loan Amount |
|---|---|---|---|
| Open | Jensen Alan Nathan | $216,930 |
Source: Public Records
Tax History
| Year | Tax Paid | Tax Assessment Tax Assessment Total Assessment is a certain percentage of the fair market value that is determined by local assessors to be the total taxable value of land and additions on the property. | Land | Improvement |
|---|---|---|---|---|
| 2025 | $2,495 | $467,100 | $127,400 | $339,700 |
| 2024 | $2,495 | $460,900 | $119,700 | $341,200 |
| 2023 | $2,161 | $398,100 | $113,800 | $284,300 |
| 2022 | $2,260 | $407,200 | $111,600 | $295,600 |
| 2021 | $2,030 | $310,700 | $97,000 | $213,700 |
| 2020 | $1,935 | $279,500 | $78,600 | $200,900 |
| 2019 | $1,888 | $265,600 | $78,600 | $187,000 |
| 2016 | $1,571 | $212,600 | $69,800 | $142,800 |
Source: Public Records
Map
Nearby Homes
- 8087 S 615 E
- 393 E Corral Creek Dr
- 379 E Horse Creek Dr
- 397 E Tractor Dr
- 8260 S 560 E
- 274 E Water Mill Way Unit 230
- 8023 S Pinewood Dr
- 257 Water Mill Way Unit 211
- 760 E 8080 S
- 257 E Water Mill Way
- 8322 S Levine Ln Unit 111
- 7824 S 280 E
- 190 E White Spruce Cove Unit 805
- 600 E Briarsprings Cir
- 798 E Spruce Tree Ln
- 359 E 8400 S
- 7819 S Spruce Tree Ln
- 354 E 7635 South St
- 135 E Station St
- 350 E 7635 South St
Your Personal Tour Guide
Ask me questions while you tour the home.