521 E Oak Ave El Segundo, CA 90245
Estimated Value: $1,102,000 - $1,640,000
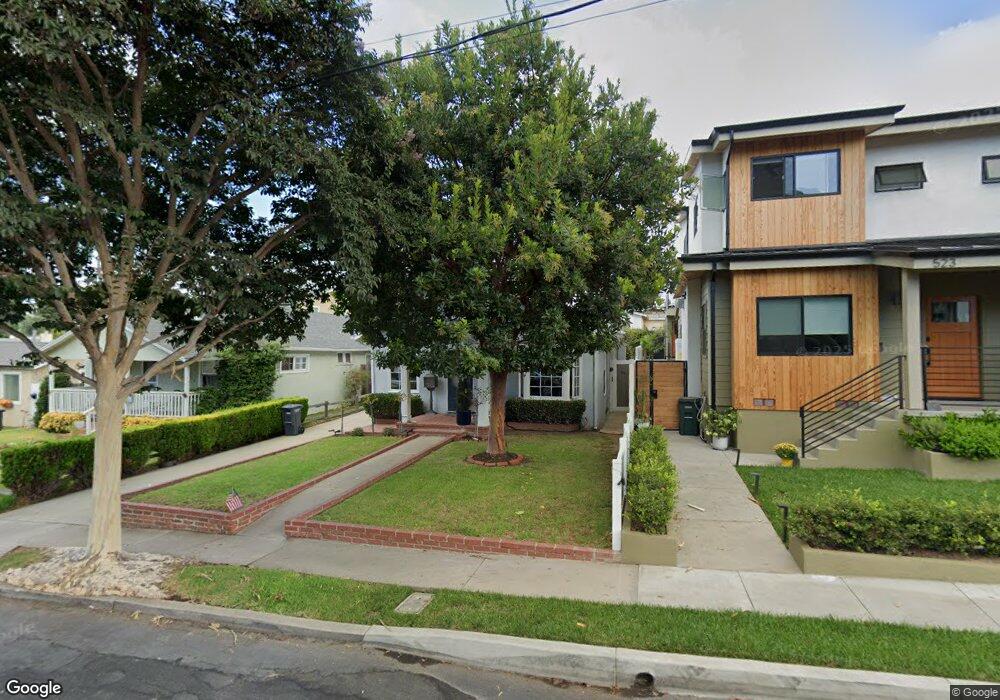
About This Home
This home is located at 521 E Oak Ave, El Segundo, CA 90245 and is currently estimated at $1,332,446, approximately $1,248 per square foot. 521 E Oak Ave is a home located in Los Angeles County with nearby schools including Center Street Elementary, El Segundo Middle School, and El Segundo High School.
Ownership History
We collect this data history from publicly available records. To have your information removed, we recommend requesting removal directly through your county’s website.
Purchase Details
Purchase Details
Home Financials for this Owner
Home Financials are based on the most recent Mortgage that was taken out on this home.Home Values in the Area
Average Home Value in this Area
Purchase History
We collect this data history from publicly available records. To have your information removed, we recommend requesting removal directly through your county’s website.
| Date | Buyer | Sale Price | Title Company |
|---|---|---|---|
| -- | None Available | ||
| $237,000 | Title Land Company |
Mortgage History
We collect this data history from publicly available records. To have your information removed, we recommend requesting removal directly through your county’s website.
| Date | Status | Borrower | Loan Amount |
|---|---|---|---|
| Open | $171,000 |
Tax History
We collect this data history from publicly available records. To have your information removed, we recommend requesting removal directly through your county’s website.
| Year | Tax Paid | Tax Assessment Tax Assessment Total Assessment is a certain percentage of the fair market value that is determined by local assessors to be the total taxable value of land and additions on the property. | Land | Improvement |
|---|---|---|---|---|
| 2025 | $4,475 | $393,691 | $314,963 | $78,728 |
| 2024 | $4,360 | $385,973 | $308,788 | $77,185 |
| 2023 | $4,248 | $378,406 | $302,734 | $75,672 |
| 2022 | $4,293 | $370,988 | $296,799 | $74,189 |
| 2021 | $4,233 | $363,715 | $290,980 | $72,735 |
| 2020 | $4,153 | $359,987 | $287,997 | $71,990 |
| 2019 | $4,088 | $352,929 | $282,350 | $70,579 |
| 2018 | $3,817 | $346,010 | $276,814 | $69,196 |
| 2016 | $3,700 | $332,576 | $266,066 | $66,510 |
| 2015 | $3,653 | $327,581 | $262,070 | $65,511 |
| 2014 | $3,581 | $321,165 | $256,937 | $64,228 |
Map
- 628 Penn St
- 526 Sheldon St
- 836 Eucalyptus Dr
- 529 E Walnut Ave
- 438 Sierra St
- 825 Bungalow Dr
- 758 Bungalow Dr
- 203 E Sycamore Ave
- 864 Maryland St
- 211 E Pine Ave
- 944 Sheldon St
- 929 Lomita St
- 426 E Imperial Ave
- 865 Center St
- 906 E Imperial Ave
- 121 E Walnut Ave
- 212 E Imperial Ave Unit A
- 212 E Imperial Ave Unit E
- 417 Standard St
- 317 Sheldon St
Ask me questions while you tour the home.