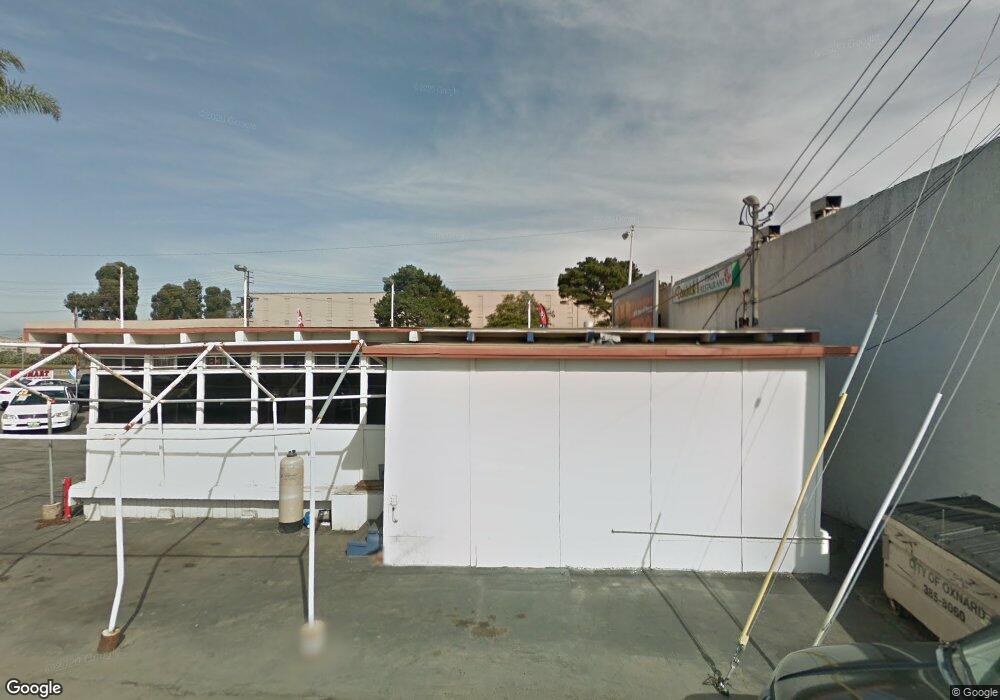
521 N Oxnard Blvd Oxnard, CA 93030
Wilson NeighborhoodEstimated Value: $714,057
Studio
--
Bath
418
Sq Ft
$1,708/Sq Ft
Est. Value
About This Home
This home is located at 521 N Oxnard Blvd, Oxnard, CA 93030 and is currently estimated at $714,057, approximately $1,708 per square foot. 521 N Oxnard Blvd is a home located in Ventura County with nearby schools including Curren School, Pacifica High School, and Vista Real Charter High School.
Ownership History
Date
Name
Owned For
Owner Type
Purchase Details
Closed on
Jul 30, 2016
Sold by
Ordaz Jose and Ordaz Alicia
Bought by
Ordaz Jose Luis and Ordaz Alicia
Current Estimated Value
Purchase Details
Closed on
Aug 26, 1996
Sold by
Tiger Ventura County Lp
Bought by
Ordaz Jose and Ordaz Alicia
Home Financials for this Owner
Home Financials are based on the most recent Mortgage that was taken out on this home.
Original Mortgage
$120,000
Outstanding Balance
$10,332
Interest Rate
8.23%
Mortgage Type
Commercial
Estimated Equity
$707,000
Purchase Details
Closed on
Feb 23, 1996
Sold by
Mvs Inc
Bought by
Tiger Ventura County Lp
Home Financials for this Owner
Home Financials are based on the most recent Mortgage that was taken out on this home.
Original Mortgage
$150,000,000
Interest Rate
7.04%
Mortgage Type
Commercial
Create a Home Valuation Report for This Property
The Home Valuation Report is an in-depth analysis detailing your home's value as well as a comparison with similar homes in the area
Home Values in the Area
Average Home Value in this Area
Purchase History
| Date | Buyer | Sale Price | Title Company |
|---|---|---|---|
| Ordaz Jose Luis | -- | None Available | |
| Ordaz Jose | $185,000 | Continental Lawyers Title | |
| Tiger Ventura County Lp | -- | Chicago Title Co |
Source: Public Records
Mortgage History
| Date | Status | Borrower | Loan Amount |
|---|---|---|---|
| Open | Ordaz Jose | $120,000 | |
| Previous Owner | Tiger Ventura County Lp | $150,000,000 |
Source: Public Records
Tax History
| Year | Tax Paid | Tax Assessment Tax Assessment Total Assessment is a certain percentage of the fair market value that is determined by local assessors to be the total taxable value of land and additions on the property. | Land | Improvement |
|---|---|---|---|---|
| 2025 | $3,781 | $301,274 | $285,008 | $16,266 |
| 2024 | $3,781 | $295,367 | $279,419 | $15,948 |
| 2023 | $3,648 | $289,576 | $273,940 | $15,636 |
| 2022 | $3,542 | $283,899 | $268,569 | $15,330 |
| 2021 | $3,514 | $278,333 | $263,303 | $15,030 |
| 2020 | $3,577 | $275,481 | $260,604 | $14,877 |
| 2019 | $3,480 | $270,081 | $255,495 | $14,586 |
| 2018 | $3,433 | $264,786 | $250,486 | $14,300 |
| 2017 | $3,264 | $259,595 | $245,575 | $14,020 |
| 2016 | $3,154 | $254,506 | $240,760 | $13,746 |
| 2015 | $3,186 | $250,686 | $237,145 | $13,541 |
| 2014 | -- | $245,777 | $232,500 | $13,277 |
Source: Public Records
Map
Nearby Homes
- 246 Doris Ave
- 255 Douglas Ave
- 800 S A St
- 425 W 1st St
- 411 Eastwood Dr
- 303 N F St Unit 201
- 307 N F St Unit 102
- 403 E 2nd St
- 722 W Robert Ave
- 715 W Robert Ave
- 201 203 S E St
- 151 S F St
- 1127 Douglas Ave
- 729 Ivywood Dr
- 1220 W Robert Ave
- 462 N M St
- 633 Meta St
- 565 Rosalinda Dr
- 550 S G St
- 620 W Gonzales Rd
Your Personal Tour Guide
Ask me questions while you tour the home.