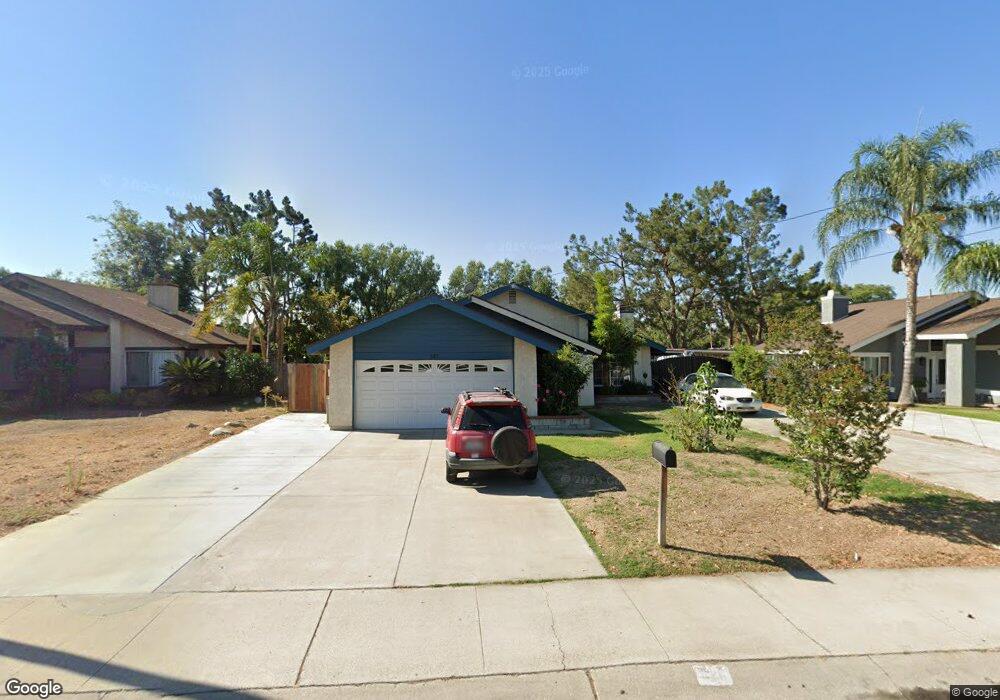
521 W Maple St Ontario, CA 91762
Downtown Ontario NeighborhoodEstimated Value: $756,599 - $785,000
4
Beds
2
Baths
1,743
Sq Ft
$444/Sq Ft
Est. Value
About This Home
This home is located at 521 W Maple St, Ontario, CA 91762 and is currently estimated at $774,650, approximately $444 per square foot. 521 W Maple St is a home located in San Bernardino County with nearby schools including Richard Haynes Elementary, Oaks Middle, and Ontario High School.
Ownership History
Date
Name
Owned For
Owner Type
Purchase Details
Closed on
Nov 30, 2019
Sold by
Vannguyen Khuon and Nguyen Tho Thi
Bought by
Vannguyen Khuon and Nguyen Tho Thi
Current Estimated Value
Purchase Details
Closed on
Oct 20, 2014
Sold by
Nguyen Mary Thi
Bought by
Vannguyen Khuon
Purchase Details
Closed on
May 13, 2014
Sold by
Vannguyen Khuon Van
Bought by
Nguyen Mary Thi
Purchase Details
Closed on
Jun 1, 2007
Sold by
Nguyen Tho Thi
Bought by
Vannguyen Khuon
Home Financials for this Owner
Home Financials are based on the most recent Mortgage that was taken out on this home.
Original Mortgage
$150,000
Outstanding Balance
$91,535
Interest Rate
6.14%
Mortgage Type
New Conventional
Estimated Equity
$683,115
Purchase Details
Closed on
Jan 7, 2004
Sold by
Vannguyen Phil Van
Bought by
Vannguyen Khuon Van and Nguyen Tho Thi
Purchase Details
Closed on
Sep 29, 1903
Sold by
Vannguyen Thoai
Bought by
Vannguyen Phil
Create a Home Valuation Report for This Property
The Home Valuation Report is an in-depth analysis detailing your home's value as well as a comparison with similar homes in the area
Home Values in the Area
Average Home Value in this Area
Purchase History
| Date | Buyer | Sale Price | Title Company |
|---|---|---|---|
| Vannguyen Khuon | -- | None Available | |
| Vannguyen Khuon | -- | Accommodation | |
| Nguyen Mary Thi | -- | Accommodation | |
| Vannguyen Khuon | -- | Stewart Title | |
| Vannguyen Khuon Van | -- | -- | |
| Vannguyen Phil | -- | -- |
Source: Public Records
Mortgage History
| Date | Status | Borrower | Loan Amount |
|---|---|---|---|
| Open | Vannguyen Khuon | $150,000 |
Source: Public Records
Tax History Compared to Growth
Tax History
| Year | Tax Paid | Tax Assessment Tax Assessment Total Assessment is a certain percentage of the fair market value that is determined by local assessors to be the total taxable value of land and additions on the property. | Land | Improvement |
|---|---|---|---|---|
| 2025 | $4,549 | $423,051 | $147,827 | $275,224 |
| 2024 | $4,549 | $414,755 | $144,928 | $269,827 |
| 2023 | $4,421 | $406,622 | $142,086 | $264,536 |
| 2022 | $4,363 | $398,649 | $139,300 | $259,349 |
| 2021 | $4,336 | $390,833 | $136,569 | $254,264 |
| 2020 | $4,260 | $386,826 | $135,169 | $251,657 |
| 2019 | $4,223 | $379,242 | $132,519 | $246,723 |
| 2018 | $4,165 | $371,806 | $129,921 | $241,885 |
| 2017 | $4,016 | $364,516 | $127,374 | $237,142 |
| 2016 | $3,857 | $357,368 | $124,876 | $232,492 |
| 2015 | $3,831 | $357,500 | $125,000 | $232,500 |
| 2014 | $3,804 | $353,749 | $104,385 | $249,364 |
Source: Public Records
Map
Nearby Homes
- 1546 Redwood Ave
- 1849 S San Antonio Ave
- 4251 S Grasly Paseo
- 1620 S Cypress Ave
- 1949 S Palm Place
- 2022 S San Antonio Ave
- 1420 S Euclid Ave Unit A & B
- 559 W Belmont St
- 653 W Belmont St
- 550 W Belmont St
- 646 W Belmont St
- 558 W Philadelphia St
- 1214 S Cypress Ave Unit G
- 1216 S Cypress Ave Unit E
- 754 W Belmont St
- 304 E Cedar St
- 1706 S Mountain Ave
- 1540 S Pleasant Ave
- 1726 S Mountain Ave Unit C
- 1712 S Mountain Ave Unit E
- 515 W Maple St
- 527 W Maple St
- 509 W Maple St
- 503 W Maple St
- 518 W Maple St
- 532 W Maple St
- 504 W Maple St
- 502 W Maple St
- 459 W Maple St
- 460 W Maple St
- 453 W Maple St
- 552 W Maple St
- 524 W Maple St
- 454 W Maple St
- 445 W Maple St
- 1689 S San Antonio Ave
- 1665 S San Antonio Ave
- 439 W Maple St
- 456 W Francis St
- 448 W Maple St