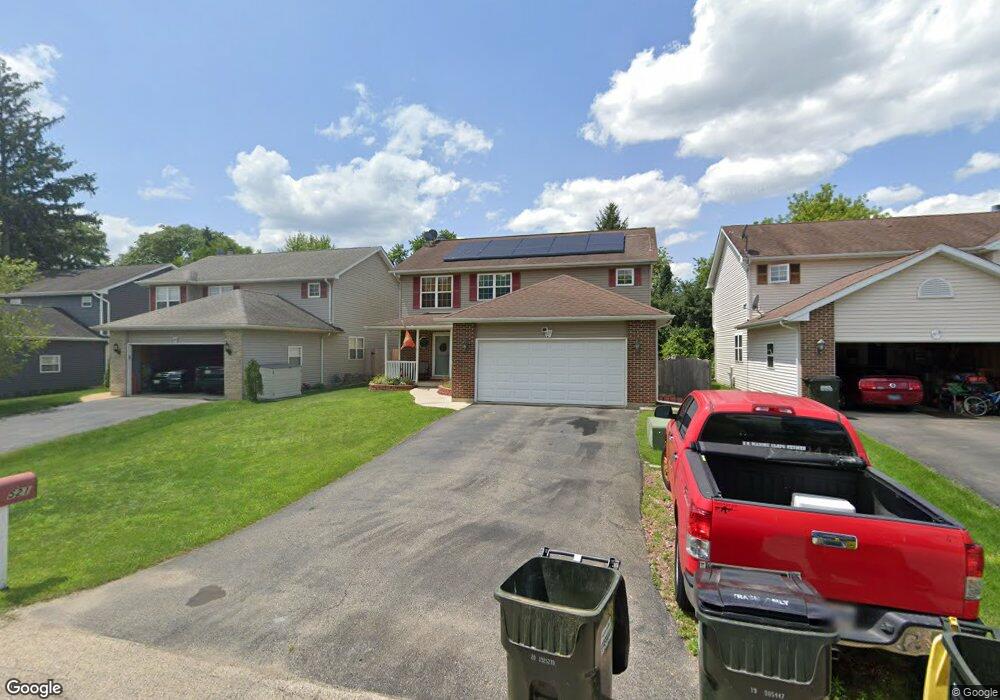
521 W Sheridan Rd Lakemoor, IL 60051
Estimated Value: $141,097
--
Bed
--
Bath
--
Sq Ft
1.54
Acres
About This Home
This home is located at 521 W Sheridan Rd, Lakemoor, IL 60051 and is currently estimated at $141,097. 521 W Sheridan Rd is a home located in McHenry County with nearby schools including Hilltop Elementary School, Chauncey H Duker School, and Mchenry Middle School.
Ownership History
Date
Name
Owned For
Owner Type
Purchase Details
Closed on
Jan 11, 2019
Sold by
Majcher Mark S and Majcher Donna M
Bought by
521 Sheridan Llc
Current Estimated Value
Purchase Details
Closed on
Dec 24, 2016
Sold by
Commercial Stack I Llc
Bought by
Majcher Mark S and Revo Donnal
Purchase Details
Closed on
Oct 30, 2007
Sold by
Lesperance Michael A and Lesperance Cynthia S
Bought by
Vonhelms John S and Von Helms Dixie
Home Financials for this Owner
Home Financials are based on the most recent Mortgage that was taken out on this home.
Original Mortgage
$120,000
Interest Rate
7%
Mortgage Type
Commercial
Purchase Details
Closed on
Oct 12, 2007
Sold by
Schneider Rachele and Grandolfo Giuseppe
Bought by
Lesperance Michael A and Lesperance Cynthia S
Home Financials for this Owner
Home Financials are based on the most recent Mortgage that was taken out on this home.
Original Mortgage
$120,000
Interest Rate
7%
Mortgage Type
Commercial
Create a Home Valuation Report for This Property
The Home Valuation Report is an in-depth analysis detailing your home's value as well as a comparison with similar homes in the area
Home Values in the Area
Average Home Value in this Area
Purchase History
| Date | Buyer | Sale Price | Title Company |
|---|---|---|---|
| 521 Sheridan Llc | $80,000 | None Available | |
| Majcher Mark S | $145,000 | Chicago Title | |
| Vonhelms John S | $147,900 | Ticor Title | |
| Lesperance Michael A | -- | Ticor Title |
Source: Public Records
Mortgage History
| Date | Status | Borrower | Loan Amount |
|---|---|---|---|
| Previous Owner | Vonhelms John S | $120,000 |
Source: Public Records
Tax History Compared to Growth
Tax History
| Year | Tax Paid | Tax Assessment Tax Assessment Total Assessment is a certain percentage of the fair market value that is determined by local assessors to be the total taxable value of land and additions on the property. | Land | Improvement |
|---|---|---|---|---|
| 2024 | $3,353 | $40,374 | $2,593 | $37,781 |
| 2023 | $3,274 | $36,206 | $2,325 | $33,881 |
| 2022 | $2,878 | $30,841 | $2,872 | $27,969 |
| 2021 | $2,767 | $28,916 | $2,693 | $26,223 |
| 2020 | $2,742 | $28,049 | $2,612 | $25,437 |
| 2019 | $2,689 | $26,667 | $2,483 | $24,184 |
| 2018 | $3,286 | $29,406 | $2,332 | $27,074 |
| 2017 | $3,240 | $28,172 | $2,234 | $25,938 |
| 2016 | $3,200 | $26,879 | $2,131 | $24,748 |
| 2013 | -- | $25,580 | $2,028 | $23,552 |
Source: Public Records
Map
Nearby Homes
- 95 W South Dr
- 236 Venice Rd
- 724 W Friendly Ave
- 105 N Sumac Ave
- 31918 Hillside Dr
- 803 East Blvd
- 28794 W Pondview Dr
- 132 Rand Rd
- 0 Rand Rd
- 28744 W Pondview Dr Unit 28744
- 425 Northlake Rd
- 336 Rosedale Dr
- 312 N Cresthill Ave
- 28676 W Schlesser Dr
- 31577 N Clearwater Dr
- Lot 8 & 9 S Lily Lake Rd
- 411 S Lily Lake Rd
- 32004 Savannah Dr
- 32006 W Savannah Dr
- 32012 Savannah Dr
- 537 Fritzsche Rd
- 533 Fritzsche Rd
- 507 W Sheridan Rd
- 513 W Sheridan Rd Unit 513
- 535 Fritzsche Rd
- 531 Fritzsche Rd
- 509 W Sheridan Rd
- 547 Fritzsche Rd
- 545 Fritzsche Rd
- 517 W Sheridan Rd
- 541 Fritzsche Rd
- 541 Fritzsche Rd Unit D
- 519 W Sheridan Rd
- 549 W Sheridan Rd Unit A
- 520 Herbert Rd
- 603 Barbara Ln
- 606 Barbara Ln
- 606 Nancy Ln
- Lot 8 Sheridan Rd
- 603 W Sheridan Rd