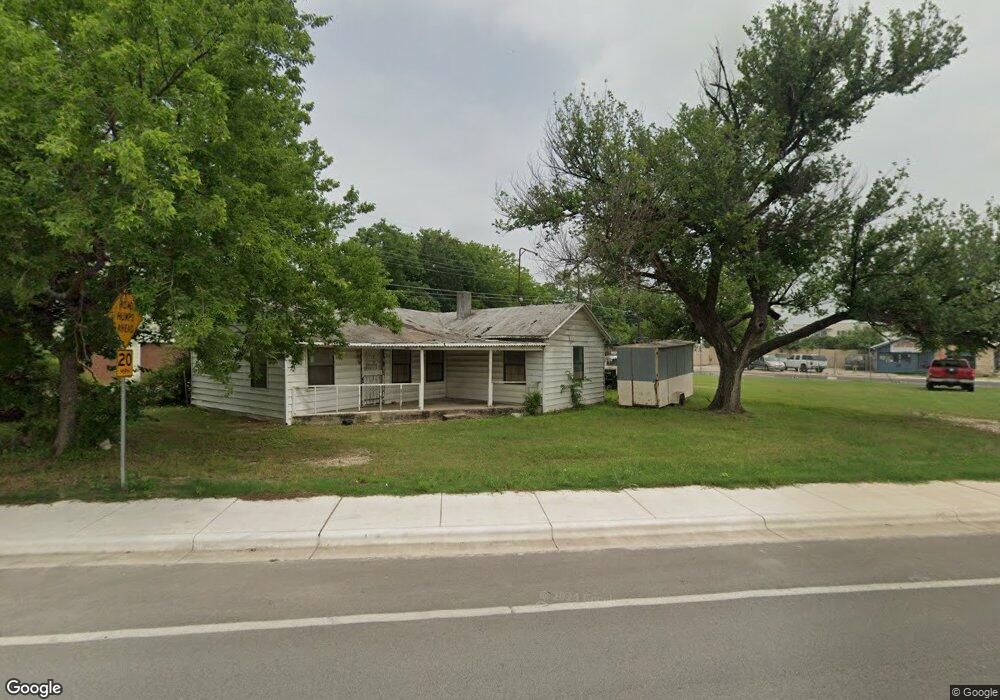
5210 Bruning St Austin, TX 78751
North Loop NeighborhoodEstimated Value: $413,143 - $964,000
Studio
1
Bath
908
Sq Ft
$670/Sq Ft
Est. Value
About This Home
This home is located at 5210 Bruning St, Austin, TX 78751 and is currently estimated at $608,536, approximately $670 per square foot. 5210 Bruning St is a home located in Travis County with nearby schools including Ridgetop Elementary School, Lamar Middle School, and McCallum High School.
Ownership History
Date
Name
Owned For
Owner Type
Purchase Details
Closed on
Dec 26, 2012
Sold by
Volz James Richard
Bought by
Jev Family Ltd
Current Estimated Value
Create a Home Valuation Report for This Property
The Home Valuation Report is an in-depth analysis detailing your home's value as well as a comparison with similar homes in the area
Home Values in the Area
Average Home Value in this Area
Purchase History
| Date | Buyer | Sale Price | Title Company |
|---|---|---|---|
| Jev Family Ltd | -- | None Available |
Source: Public Records
Tax History
| Year | Tax Paid | Tax Assessment Tax Assessment Total Assessment is a certain percentage of the fair market value that is determined by local assessors to be the total taxable value of land and additions on the property. | Land | Improvement |
|---|---|---|---|---|
| 2025 | $7,163 | $350,000 | $350,000 | -- |
| 2023 | $6,662 | $368,199 | $368,198 | $1 |
| 2022 | $7,846 | $397,257 | $368,198 | $29,059 |
| 2021 | $8,581 | $394,221 | $368,198 | $26,023 |
| 2020 | $8,456 | $394,221 | $368,198 | $26,023 |
| 2018 | $4,668 | $210,856 | $184,099 | $26,757 |
| 2017 | $4,676 | $209,653 | $184,099 | $25,554 |
| 2016 | $4,755 | $213,231 | $184,099 | $29,132 |
| 2015 | $6,288 | $213,231 | $184,099 | $29,132 |
| 2014 | $6,288 | $264,212 | $247,500 | $16,712 |
Source: Public Records
Map
Nearby Homes
- 5114 Caswell Ave
- 907 E 53rd St
- 5014 Martin Ave
- 605 E 55th St Unit 4
- 605 E 55th St Unit 6
- 605 E 55th St Unit 5
- 605 E 55th St
- 5403 Duval St Unit 1
- 705 E 50th St
- 912 1/2 E 50th St
- 5500 Evans Ave
- 909 E 50th St
- 5200 Avenue H
- 930 E 52nd St
- 5403 Avenue H
- 928 E 53rd 1 2 St Unit 1
- 4911 Duval St
- 705 E 49th St Unit A
- 701 E 49th St Unit B
- 5204 Avenue G
- 701 E 53rd St
- 5206 Eilers Ave
- 5211 Martin Ave
- 5203 Martin Ave
- 5203 Martin Ave Unit 1
- 5301 Martin Ave
- 5211 Eilers Ave Unit B6
- 5211 Eilers Ave
- 5303 Martin Ave
- 5207 Eilers Ave
- 5208 Martin Ave
- 5210 Martin Ave
- 5200 Eilers Ave
- 5206 Martin Ave
- 5212 Martin Ave
- 5205 Eilers Ave
- 5305 Martin Ave
- 5204 Martin Ave Unit C
- 5204 Martin Ave Unit A
- 5204 Martin Ave
Your Personal Tour Guide
Ask me questions while you tour the home.