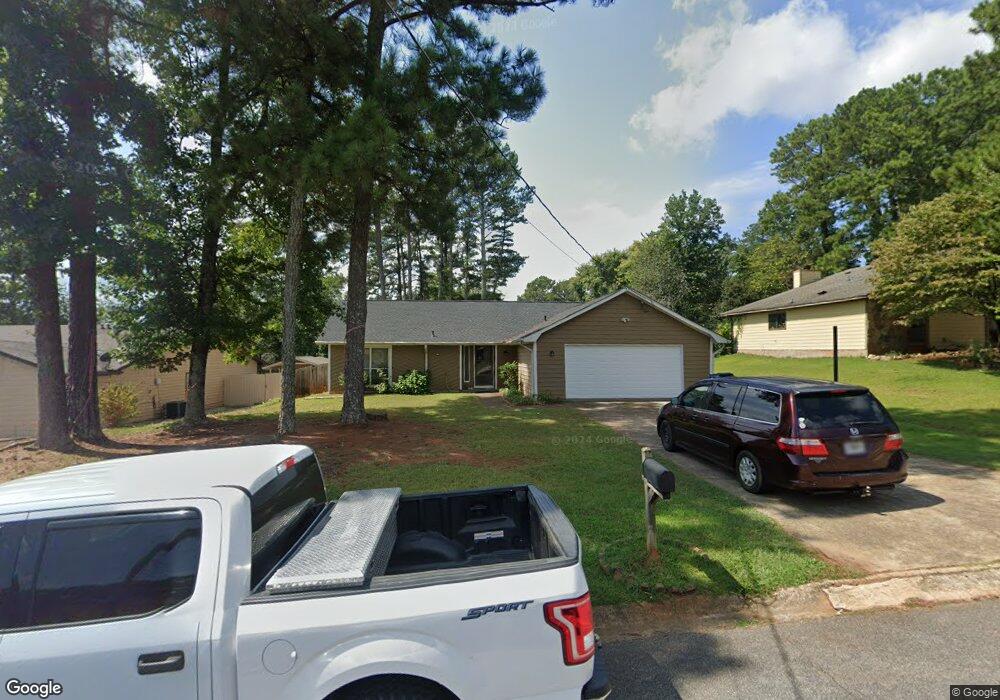
5214 Downs Ln Norcross, GA 30093
Estimated Value: $339,730 - $369,000
3
Beds
2
Baths
1,896
Sq Ft
$185/Sq Ft
Est. Value
About This Home
This home is located at 5214 Downs Ln, Norcross, GA 30093 and is currently estimated at $350,683, approximately $184 per square foot. 5214 Downs Ln is a home located in Gwinnett County with nearby schools including Meadowcreek Elementary School, Louise Radloff Middle School, and Meadowcreek High School.
Ownership History
Date
Name
Owned For
Owner Type
Purchase Details
Closed on
Mar 7, 2011
Sold by
Chou Jeng H and Chou Chin Y
Bought by
Chou Jeng H and Chou Chin-Ying C
Current Estimated Value
Purchase Details
Closed on
Dec 3, 2009
Sold by
Federal Home Loan Mortgage Corporation
Bought by
Chou Jeng H and Chou Chin Y
Purchase Details
Closed on
Sep 1, 2009
Sold by
Branch Bkng & Trust
Bought by
Federal Home Loan Mortgage Corporation
Purchase Details
Closed on
Jun 29, 2001
Sold by
Campechano Patricia V
Bought by
Campachano Patricia V
Home Financials for this Owner
Home Financials are based on the most recent Mortgage that was taken out on this home.
Original Mortgage
$126,003
Interest Rate
6.5%
Mortgage Type
New Conventional
Purchase Details
Closed on
Dec 4, 1996
Sold by
Cook Tony B Kathy L
Bought by
Cardenas Nestor F Gina P
Create a Home Valuation Report for This Property
The Home Valuation Report is an in-depth analysis detailing your home's value as well as a comparison with similar homes in the area
Home Values in the Area
Average Home Value in this Area
Purchase History
| Date | Buyer | Sale Price | Title Company |
|---|---|---|---|
| Chou Jeng H | -- | -- | |
| Chou Jeng H | -- | -- | |
| Federal Home Loan Mortgage Corporation | -- | -- | |
| Branch Bkng & Trust Co | $99,402 | -- | |
| Campachano Patricia V | -- | -- | |
| Campechano Patricia V | $129,900 | -- | |
| Cardenas Nestor F Gina P | $94,400 | -- |
Source: Public Records
Mortgage History
| Date | Status | Borrower | Loan Amount |
|---|---|---|---|
| Previous Owner | Campechano Patricia V | $126,003 | |
| Closed | Cardenas Nestor F Gina P | $0 |
Source: Public Records
Tax History
| Year | Tax Paid | Tax Assessment Tax Assessment Total Assessment is a certain percentage of the fair market value that is determined by local assessors to be the total taxable value of land and additions on the property. | Land | Improvement |
|---|---|---|---|---|
| 2025 | -- | $147,120 | $21,120 | $126,000 |
| 2024 | $5,319 | $138,840 | $21,120 | $117,720 |
| 2023 | $5,319 | $124,480 | $23,200 | $101,280 |
| 2022 | $4,284 | $110,600 | $14,400 | $96,200 |
| 2021 | $2,522 | $60,160 | $11,200 | $48,960 |
| 2020 | $2,534 | $60,160 | $11,200 | $48,960 |
| 2019 | $2,129 | $60,160 | $11,200 | $48,960 |
| 2018 | $2,336 | $60,160 | $11,200 | $48,960 |
| 2016 | $2,192 | $52,520 | $8,800 | $43,720 |
| 2015 | $1,354 | $28,280 | $6,400 | $21,880 |
| 2014 | -- | $28,280 | $6,400 | $21,880 |
Source: Public Records
Map
Nearby Homes
- 1450 Reddington Ln
- 1413 Silver Lake Dr
- 1455 Silver Lake Dr
- 5271 Williams Rd Unit A-1
- 994 Sandune Dr
- 1373 Wing Foot Way
- 1514 Robin Hill Dr
- 5554 Clover Rise Ln
- 0 Harbins Rd Unit 10704897
- 0 Harbins Rd Unit 7730414
- 956 Six Oaks Cir Unit B
- 1258 Roman Point Dr
- 5315 Sherwin Dr
- 5331 Sherwin Dr
- 1599 Cove Creek Cir
- 1620 Cove Creek Cir Unit 304
- 1534 Cove Creek Cir
- 5675 Terremont Cir
- 5564 Cobb Meadow
- 5411 Williams Rd
- 5208 Downs Ln
- 5220 Downs Ln Unit 3
- 1325 Country Downs Dr
- 5226 Downs Ln
- 5202 Downs Ln
- 1333 Country Downs Dr Unit 1
- 1309 Country Downs Dr
- 5213 Downs Ln Unit 3
- 5207 Downs Ln
- 5219 Downs Ln Unit 3
- 5232 Downs Ln Unit 3
- 5196 Downs Ln
- 1341 Country Downs Dr
- 1301 Country Downs Dr Unit 1
- 5225 Downs Ln
- 5201 Downs Ln
- 5195 Downs Ln
- 5231 Downs Ln
- 5238 Downs Ln Unit 3
- 1349 Country Downs Dr Unit 2
Your Personal Tour Guide
Ask me questions while you tour the home.