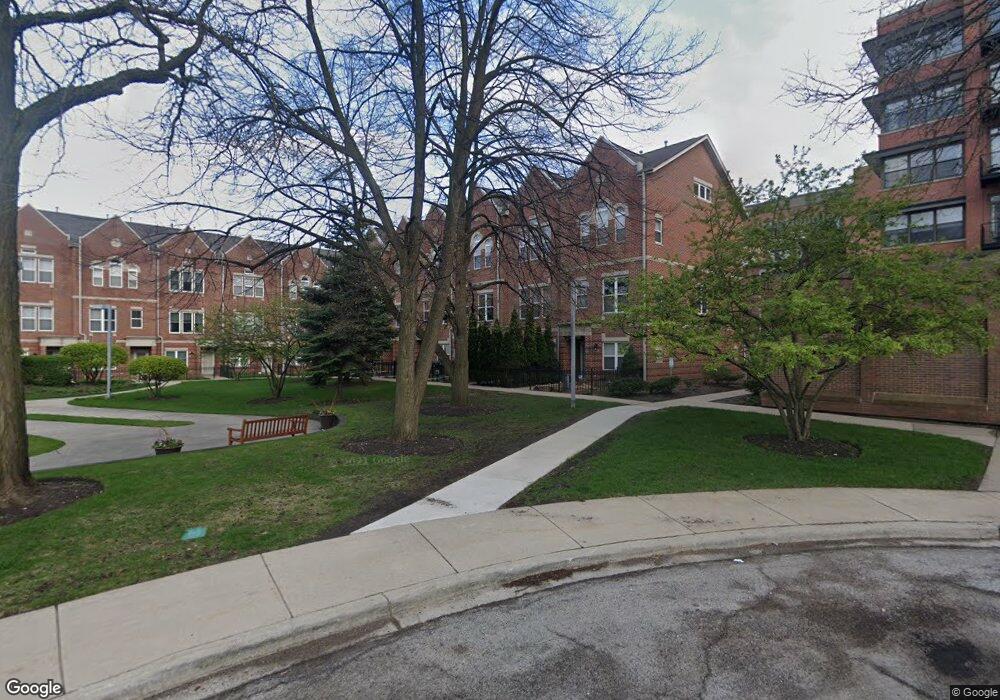
5218 S Berkeley Ave Unit A Chicago, IL 60615
Hyde Park NeighborhoodEstimated Value: $345,000 - $476,000
3
Beds
3
Baths
--
Sq Ft
784
Sq Ft Lot
About This Home
This home is located at 5218 S Berkeley Ave Unit A, Chicago, IL 60615 and is currently estimated at $398,623. 5218 S Berkeley Ave Unit A is a home located in Cook County with nearby schools including Kozminski Community Academy, Kenwood Academy High School, and The Chicago Free School.
Ownership History
Date
Name
Owned For
Owner Type
Purchase Details
Closed on
May 20, 2024
Sold by
Dexter R Voisin Living Trust and Voisin Dexter R
Bought by
Dexter R Voisin Living Trust and Voisin
Current Estimated Value
Home Financials for this Owner
Home Financials are based on the most recent Mortgage that was taken out on this home.
Original Mortgage
$120,000
Outstanding Balance
$117,887
Interest Rate
6.63%
Mortgage Type
New Conventional
Estimated Equity
$280,736
Purchase Details
Closed on
May 24, 2018
Sold by
Voisin Dexter R
Bought by
Voisin Dexter R and Dexter R Voisin Living Trust
Purchase Details
Closed on
Dec 1, 2000
Sold by
Renaissance Place Hyde Park Llc
Bought by
Voisin Dexter
Create a Home Valuation Report for This Property
The Home Valuation Report is an in-depth analysis detailing your home's value as well as a comparison with similar homes in the area
Home Values in the Area
Average Home Value in this Area
Purchase History
| Date | Buyer | Sale Price | Title Company |
|---|---|---|---|
| Dexter R Voisin Living Trust | -- | Service Link | |
| Dexter R Voisin Living Trust | -- | Service Link | |
| Dexter R Voisin Living Trust | -- | Service Link | |
| Voisin Dexter R | -- | Attorney | |
| Voisin Dexter R | -- | Attorney | |
| Voisin Dexter R | -- | Attorney | |
| Voisin Dexter | $295,000 | Chicago Title Insurance Co | |
| Voisin Dexter | $295,000 | Chicago Title Insurance Co | |
| Voisin Dexter | $295,000 | Chicago Title Insurance Co |
Source: Public Records
Mortgage History
| Date | Status | Borrower | Loan Amount |
|---|---|---|---|
| Open | Dexter R Voisin Living Trust | $120,000 |
Source: Public Records
Tax History
| Year | Tax Paid | Tax Assessment Tax Assessment Total Assessment is a certain percentage of the fair market value that is determined by local assessors to be the total taxable value of land and additions on the property. | Land | Improvement |
|---|---|---|---|---|
| 2025 | $6,074 | $39,000 | $4,910 | $34,090 |
| 2024 | $6,074 | $39,000 | $4,910 | $34,090 |
| 2023 | $5,878 | $32,000 | $3,960 | $28,040 |
| 2022 | $5,878 | $32,000 | $3,960 | $28,040 |
| 2021 | $5,765 | $32,000 | $3,960 | $28,040 |
| 2020 | $5,817 | $29,214 | $3,168 | $26,046 |
| 2019 | $5,691 | $31,755 | $3,168 | $28,587 |
| 2018 | $5,594 | $31,755 | $3,168 | $28,587 |
| 2017 | $5,315 | $28,063 | $2,613 | $25,450 |
| 2016 | $5,121 | $28,063 | $2,613 | $25,450 |
| 2015 | $4,662 | $28,063 | $2,613 | $25,450 |
| 2014 | $4,365 | $26,097 | $2,138 | $23,959 |
| 2013 | $4,268 | $26,097 | $2,138 | $23,959 |
Source: Public Records
Map
Nearby Homes
- 5200 S Ellis Ave Unit 202
- 5309 S Greenwood Ave
- 5342 S Greenwood Ave Unit 3
- 5230 S University Ave Unit D
- 5133 S Greenwood Ave Unit 2
- 951 E Hyde Park Blvd
- 5343 S Drexel Ave
- 5235 S University Ave
- 5124 S University Ave
- 843 E 52nd St Unit 1
- 5132 S Drexel Ave Unit 2D
- 1059 E Hyde Park Blvd Unit 1
- 840 E 52nd St Unit 1E
- 838 E 52nd St Unit 1W
- 5424 S Ingleside Ave
- 836 E 52nd St
- 5200 S Woodlawn Ave
- 4730 S Drexel Ave Unit 3N
- 825 E Drexel Square Unit 2
- 823 E Drexel Square
- 5218 S Berkeley Ave Unit D
- 5218 S Berkeley Ave
- 5218 S Berkeley Ave
- 5218 S Berkeley Ave
- 5218 S Berkeley Ave
- 5218 S Berkeley Ave
- 5218 S Berkeley Ave
- 5218 S Berkeley Ave Unit E
- 5218 S Berkeley Ave Unit A
- 5218 S Berkeley Ave Unit F
- 5218 S Berkeley Ave Unit C
- 5220 S Berkeley Ave Unit E
- 5220 S Berkeley Ave
- 5220 S Berkeley Ave
- 5220 S Berkeley Ave
- 5220 S Berkeley Ave
- 5220 S Berkeley Ave
- 5220 S Berkeley Ave
- 5220 S Berkeley Ave Unit C
- 5220 S Berkeley Ave Unit F
Your Personal Tour Guide
Ask me questions while you tour the home.