522 Dawn Dr Manteca, CA 95336
Downtown Manteca NeighborhoodEstimated Value: $456,978 - $488,000
About This Home
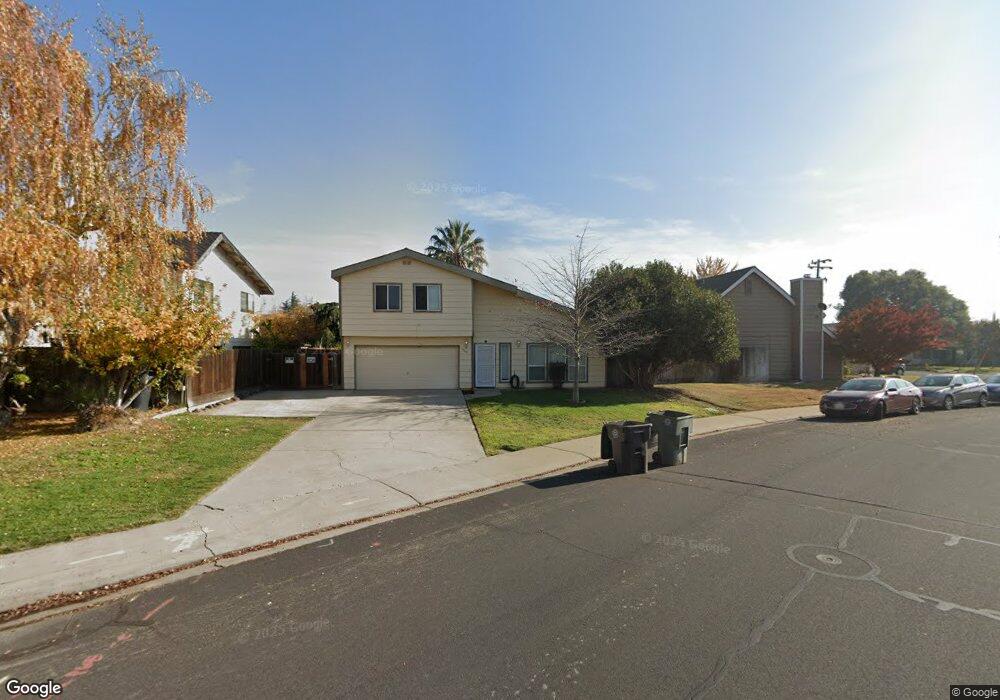
This home is located at 522 Dawn Dr, Manteca, CA 95336 and is currently estimated at $468,745, approximately $277 per square foot. 522 Dawn Dr is a home located in San Joaquin County with nearby schools including Shasta Elementary School, Manteca High School, and St. Anthony's Catholic School.
Ownership History
We collect this data history from publicly available records. To have your information removed, we recommend requesting removal directly through your county’s website.
Purchase Details
Purchase Details
Purchase Details
Purchase Details
Home Financials for this Owner
Home Financials are based on the most recent Mortgage that was taken out on this home.Purchase Details
Home Financials for this Owner
Home Financials are based on the most recent Mortgage that was taken out on this home.Home Values in the Area
Average Home Value in this Area
Purchase History
We collect this data history from publicly available records. To have your information removed, we recommend requesting removal directly through your county’s website.
| Date | Buyer | Sale Price | Title Company |
|---|---|---|---|
| -- | None Listed On Document | ||
| $142,000 | First American Title Ins Co | ||
| -- | First American Title Ins Co | ||
| -- | Financial Title Company | ||
| -- | Fidelity National Title Co | ||
| -- | Fidelity National Title Co |
Mortgage History
We collect this data history from publicly available records. To have your information removed, we recommend requesting removal directly through your county’s website.
| Date | Status | Borrower | Loan Amount |
|---|---|---|---|
| Previous Owner | $161,500 | ||
| Previous Owner | $75,000 |
Tax History
We collect this data history from publicly available records. To have your information removed, we recommend requesting removal directly through your county’s website.
| Year | Tax Paid | Tax Assessment Tax Assessment Total Assessment is a certain percentage of the fair market value that is determined by local assessors to be the total taxable value of land and additions on the property. | Land | Improvement |
|---|---|---|---|---|
| 2025 | $2,187 | $195,453 | $64,381 | $131,072 |
| 2024 | $2,126 | $191,621 | $63,119 | $128,502 |
| 2023 | $2,100 | $187,865 | $61,882 | $125,983 |
| 2022 | $2,069 | $184,182 | $60,669 | $123,513 |
| 2021 | $2,047 | $180,572 | $59,480 | $121,092 |
| 2020 | $1,964 | $178,722 | $58,871 | $119,851 |
| 2019 | $1,938 | $175,218 | $57,717 | $117,501 |
| 2018 | $1,913 | $171,784 | $56,586 | $115,198 |
| 2017 | $1,885 | $168,417 | $55,477 | $112,940 |
| 2016 | $1,840 | $165,116 | $54,390 | $110,726 |
| 2014 | $1,711 | $159,453 | $52,524 | $106,929 |
Map
- 406 E Edison St
- 517 Fir St
- 651 Pine St
- 953 Souza Blvd
- 309 Frances St
- 1113 Sutter St
- 145 N Powers Ave
- 119 N Sherman Ave
- 1152 Laureto St
- 224 N Maple Ave
- 396 Lancaster Dr
- 1275 Armstrong Dr
- 1009 Lambdin St
- 343 Poplar Ave
- 1254 Parkcrest Cir
- 1276 Parkcrest Cir
- 1306 Parkcrest Cir
- 1283 Marceline Dr
- 1288 Parkcrest Cir
- 196 Dyer Ave
Ask me questions while you tour the home.