522 Lazy Creek Cir Unit 108 Fullerton, CA 92831
Raymond Hills NeighborhoodEstimated Value: $601,000 - $982,000
2
Beds
2
Baths
1,150
Sq Ft
$634/Sq Ft
Est. Value
About This Home
This home is located at 522 Lazy Creek Cir Unit 108, Fullerton, CA 92831 and is currently estimated at $728,644, approximately $633 per square foot. 522 Lazy Creek Cir Unit 108 is a home located in Orange County with nearby schools including Beechwood Elementary School, Fullerton Union High School, and St. Angela Merici Elementary School.
Ownership History
Date
Name
Owned For
Owner Type
Purchase Details
Closed on
Apr 7, 2004
Sold by
Dinh Nathan Nam
Bought by
Dinh Gina B
Current Estimated Value
Home Financials for this Owner
Home Financials are based on the most recent Mortgage that was taken out on this home.
Original Mortgage
$249,900
Outstanding Balance
$115,892
Interest Rate
5.56%
Mortgage Type
Stand Alone First
Estimated Equity
$612,752
Purchase Details
Closed on
Mar 10, 2004
Sold by
Kent Jeffrey D and Ericson Tanya
Bought by
Dinh Gina B
Home Financials for this Owner
Home Financials are based on the most recent Mortgage that was taken out on this home.
Original Mortgage
$249,900
Outstanding Balance
$115,892
Interest Rate
5.56%
Mortgage Type
Stand Alone First
Estimated Equity
$612,752
Purchase Details
Closed on
Jan 20, 1993
Sold by
Kent Jeffrey D and Ericson Tanya
Bought by
Kent Jeffrey D and Ericson Tanya
Home Financials for this Owner
Home Financials are based on the most recent Mortgage that was taken out on this home.
Original Mortgage
$144,000
Interest Rate
7.1%
Create a Home Valuation Report for This Property
The Home Valuation Report is an in-depth analysis detailing your home's value as well as a comparison with similar homes in the area
Home Values in the Area
Average Home Value in this Area
Purchase History
| Date | Buyer | Sale Price | Title Company |
|---|---|---|---|
| Dinh Gina B | -- | Advantage Title Inc | |
| Dinh Gina B | $357,000 | Advantage Title Inc | |
| Kent Jeffrey D | -- | Chicago Title Company |
Source: Public Records
Mortgage History
| Date | Status | Borrower | Loan Amount |
|---|---|---|---|
| Open | Dinh Gina B | $249,900 | |
| Previous Owner | Kent Jeffrey D | $144,000 | |
| Closed | Dinh Gina B | $71,400 |
Source: Public Records
Tax History Compared to Growth
Tax History
| Year | Tax Paid | Tax Assessment Tax Assessment Total Assessment is a certain percentage of the fair market value that is determined by local assessors to be the total taxable value of land and additions on the property. | Land | Improvement |
|---|---|---|---|---|
| 2025 | $5,620 | $507,570 | $390,794 | $116,776 |
| 2024 | $5,620 | $497,618 | $383,131 | $114,487 |
| 2023 | $5,483 | $487,861 | $375,618 | $112,243 |
| 2022 | $5,445 | $478,296 | $368,253 | $110,043 |
| 2021 | $5,350 | $468,918 | $361,032 | $107,886 |
| 2020 | $5,319 | $464,110 | $357,330 | $106,780 |
| 2019 | $5,181 | $455,010 | $350,323 | $104,687 |
| 2018 | $5,102 | $446,089 | $343,454 | $102,635 |
| 2017 | $4,991 | $435,000 | $336,720 | $98,280 |
| 2016 | $4,491 | $390,000 | $301,090 | $88,910 |
| 2015 | $4,148 | $363,750 | $274,840 | $88,910 |
| 2014 | $4,104 | $363,750 | $274,840 | $88,910 |
Source: Public Records
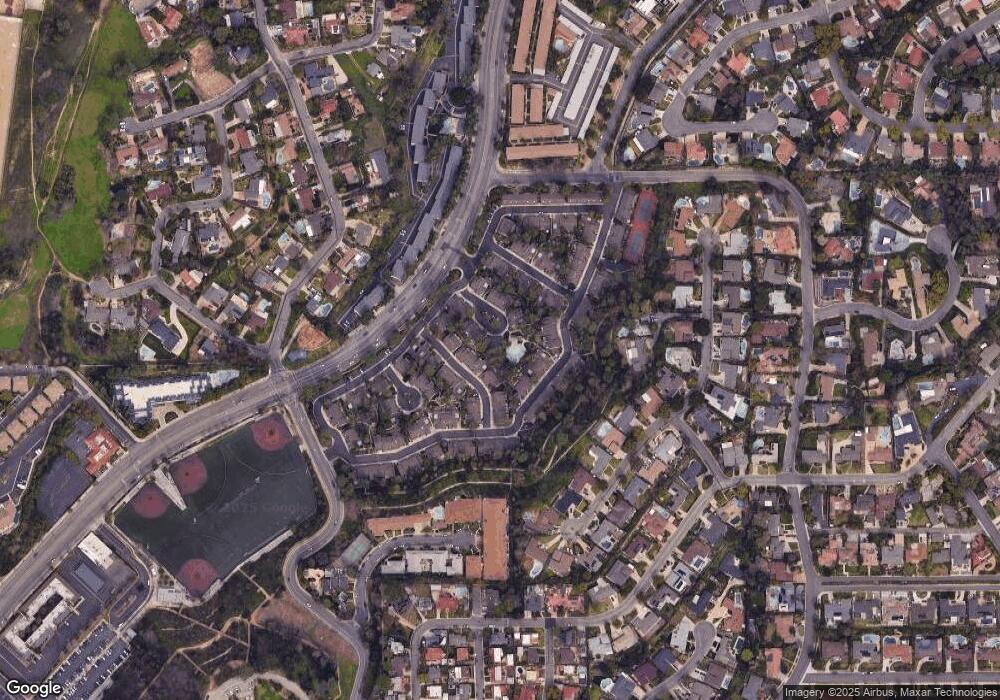
Map
Nearby Homes
- 1680 Shady Brook Dr Unit 117
- 1697 Brea Blvd Unit 231
- 1349 Shadow Ln Unit 217
- 1360 Shadow Ln Unit G
- 1354 Shadow Ln Unit (D) 202
- 1354 Shadow Ln Unit 201
- 1354 Shadow Ln Unit 102
- 0 Elsa Dr
- 1307 Shadow Ln Unit I
- 2018 Palisades Dr
- 2073 Smokewood Ave
- 404 Cannon Ln
- 1941 Skyline Dr
- 1219 N Raymond Ave
- 1709 Lychee St
- 1763 Lychee St
- 1771 Lychee St
- 1022 Currant Rd
- 1767 Lychee St
- 1481 Kensington Dr
- 520 Lazy Creek Cir Unit 107
- 520 Lazy Creek Cir
- 514 Lazy Creek Cir Unit 106
- 514 Lazy Creek Cir
- 519 Blue Water Ln Unit 91
- 517 Blue Water Ln Unit 92
- 517 Blue Water Ln
- 512 Lazy Creek Cir
- 515 Blue Water Ln
- 519 Lazy Creek Cir Unit 109
- 525 Blue Water Ln Unit 89
- 525 Blue Water Ln
- 517 Lazy Creek Cir Unit 110
- 513 Blue Water Ln Unit 94
- 513 Blue Water Ln
- 510 Lazy Creek Cir
- 527 Blue Water Ln
- 507 Blue Water Ln Unit 95
- 513 Lazy Creek Cir Unit 111
- 513 Lazy Creek Cir