5220 Edgar St Unit 41 Oxnard, CA 93033
Cypress NeighborhoodEstimated Value: $717,000 - $748,000
4
Beds
3
Baths
1,866
Sq Ft
$390/Sq Ft
Est. Value
About This Home
This home is located at 5220 Edgar St Unit 41, Oxnard, CA 93033 and is currently estimated at $727,770, approximately $390 per square foot. 5220 Edgar St Unit 41 is a home located in Ventura County with nearby schools including Channel Islands High School.
Ownership History
Date
Name
Owned For
Owner Type
Purchase Details
Closed on
Jun 14, 2013
Sold by
Rodriguez Alexsander and Martinez Maria C
Bought by
Tirado Alexsander Rodriguez and Germoso Maria Cristina Martinez
Current Estimated Value
Purchase Details
Closed on
Jan 25, 2010
Sold by
Rodriguez Alexsander and Martinez Maria C
Bought by
Rodriguez Alexsander and Martinez Maria C
Home Financials for this Owner
Home Financials are based on the most recent Mortgage that was taken out on this home.
Original Mortgage
$288,700
Interest Rate
4.44%
Mortgage Type
New Conventional
Purchase Details
Closed on
Dec 3, 2007
Sold by
Cc Community Co Llc
Bought by
Tirado Alexsander Rodriguez and Germoso Maria C Martinez
Home Financials for this Owner
Home Financials are based on the most recent Mortgage that was taken out on this home.
Original Mortgage
$321,600
Interest Rate
6.21%
Mortgage Type
Purchase Money Mortgage
Create a Home Valuation Report for This Property
The Home Valuation Report is an in-depth analysis detailing your home's value as well as a comparison with similar homes in the area
Home Values in the Area
Average Home Value in this Area
Purchase History
| Date | Buyer | Sale Price | Title Company |
|---|---|---|---|
| Tirado Alexsander Rodriguez | -- | None Available | |
| Rodriguez Alexsander | -- | Lsi Title Company Santa Ana | |
| Tirado Alexsander Rodriguez | $402,000 | Fidelity National Title Co |
Source: Public Records
Mortgage History
| Date | Status | Borrower | Loan Amount |
|---|---|---|---|
| Closed | Rodriguez Alexsander | $288,700 | |
| Closed | Tirado Alexsander Rodriguez | $321,600 |
Source: Public Records
Tax History
| Year | Tax Paid | Tax Assessment Tax Assessment Total Assessment is a certain percentage of the fair market value that is determined by local assessors to be the total taxable value of land and additions on the property. | Land | Improvement |
|---|---|---|---|---|
| 2025 | $5,938 | $528,020 | $343,482 | $184,538 |
| 2024 | $5,938 | $517,667 | $336,747 | $180,920 |
| 2023 | $5,914 | $507,517 | $330,144 | $177,373 |
| 2022 | $5,632 | $497,566 | $323,670 | $173,896 |
| 2021 | $5,739 | $487,810 | $317,323 | $170,487 |
| 2020 | $5,896 | $482,810 | $314,070 | $168,740 |
| 2019 | $5,637 | $473,344 | $307,912 | $165,432 |
| 2018 | $5,516 | $464,064 | $301,875 | $162,189 |
| 2017 | $5,288 | $454,965 | $295,956 | $159,009 |
| 2016 | $5,177 | $446,045 | $290,153 | $155,892 |
| 2015 | $5,165 | $405,000 | $264,000 | $141,000 |
| 2014 | $4,104 | $315,000 | $205,000 | $110,000 |
Source: Public Records
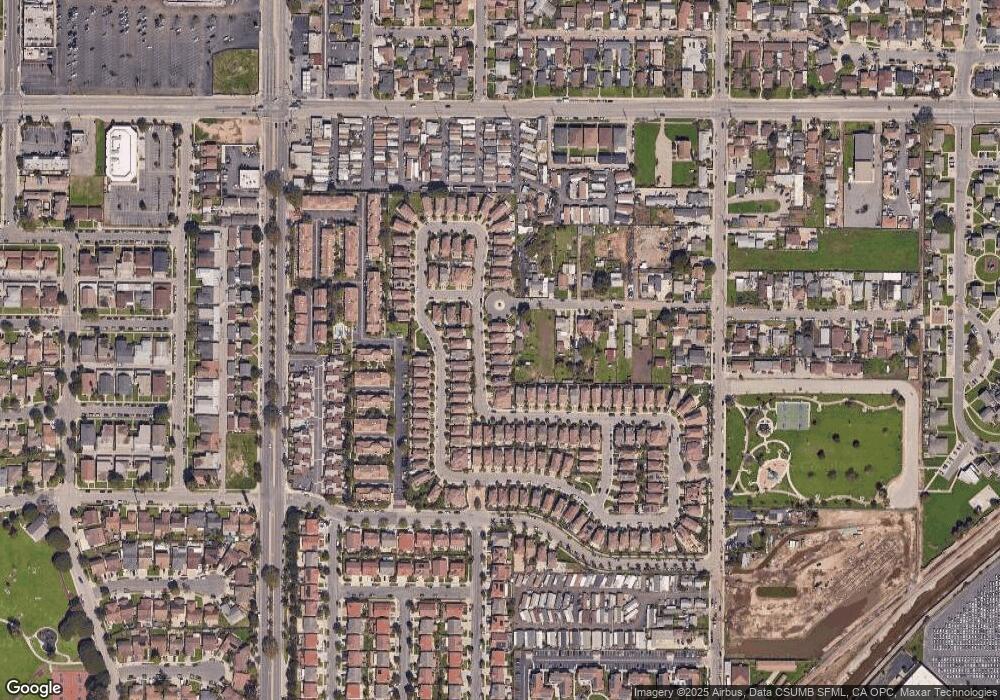
Map
Nearby Homes
- 5225 Columbus Place
- 5302 Barrymore Dr
- 5117 Jefferson Square
- 4710 Clover Dr
- 341 Cuesta Del Mar Dr
- 5222 Longfellow Way
- 4910 Justin Way
- 5121 Perkins Rd
- 5340 S J St
- 4200 S A St
- 320 Columbia Place Unit 46
- 4731 Hamilton Ave
- 4160 Petit Dr Unit 39
- 165 Courtyard Dr Unit 26
- 912 Maplewood Way
- 117 Ann Ave
- 218 Morning Breeze Ln
- 360 Ibsen Place Unit 129
- 226 Morning Breeze Ln
- 4340 Highland Ave
- 5230 Edgar St
- 5210 Edgar St Unit 40
- 5240 Edgar St
- 5200 Edgar St
- 5250 Edgar St Unit 44
- 310 Howell Rd
- 5222 Davidson Dr
- 5212 Davidson Dr Unit 100
- 5212 Davidson Dr
- 5260 Edgar St
- 335 Dylan Dr
- 5202 Davidson Dr Unit 101
- 5202 Davidson Dr
- 5232 Davidson Dr
- 5242 Davidson Dr
- 254 Cummings Way
- 345 Dylan Dr Unit 48
- 5270 Edgar St
- 5252 Davidson Dr
- 355 Dylan Dr
Your Personal Tour Guide
Ask me questions while you tour the home.