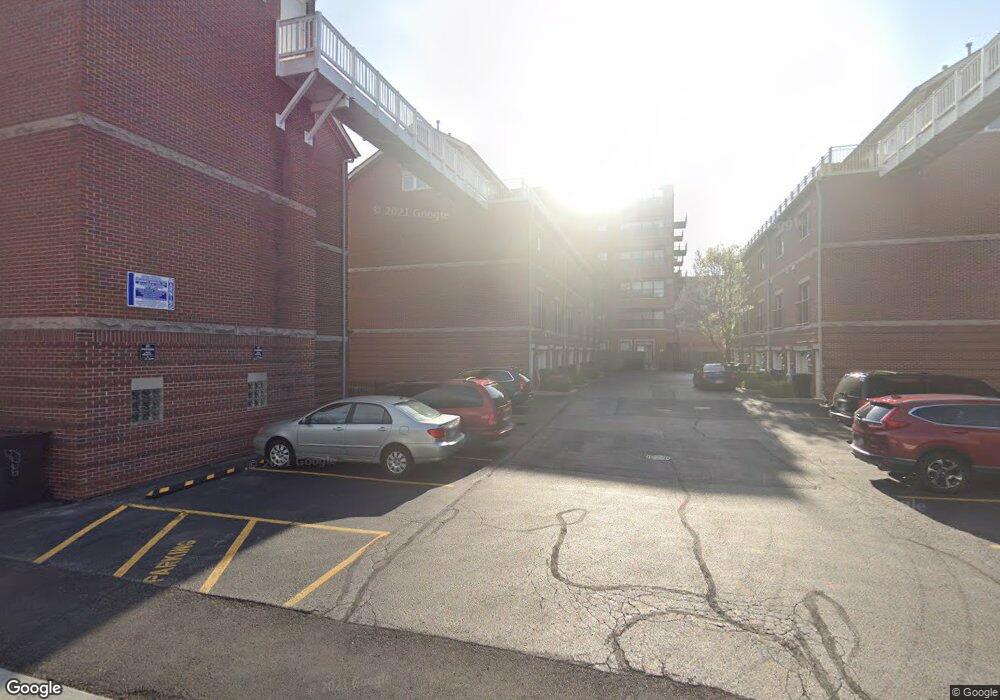
5220 S Berkeley Ave Chicago, IL 60615
Hyde Park NeighborhoodEstimated Value: $333,000 - $466,000
2
Beds
2
Baths
1,404
Sq Ft
$298/Sq Ft
Est. Value
About This Home
This home is located at 5220 S Berkeley Ave, Chicago, IL 60615 and is currently estimated at $418,001, approximately $297 per square foot. 5220 S Berkeley Ave is a home located in Cook County with nearby schools including Kozminski Community Academy, Kenwood Academy High School, and The Chicago Free School.
Ownership History
Date
Name
Owned For
Owner Type
Purchase Details
Closed on
Oct 25, 2024
Sold by
Susan E Macinnes Declaration Of Trust and Macinnes Susan E
Bought by
Zinn James and Zinn Tamara
Current Estimated Value
Purchase Details
Closed on
Jul 15, 2020
Sold by
Macinnes Susan E
Bought by
Macinnes Susan E
Purchase Details
Closed on
Apr 16, 2020
Sold by
Brent Fergusson
Bought by
Macinnes Susan E
Purchase Details
Closed on
May 1, 2013
Sold by
Xie Zheng and Chan May Guen
Bought by
Fergusson Brent
Home Financials for this Owner
Home Financials are based on the most recent Mortgage that was taken out on this home.
Original Mortgage
$70,000
Interest Rate
3.38%
Mortgage Type
Unknown
Purchase Details
Closed on
Jul 3, 2002
Sold by
Blair Kelly Samuel Alexander and Blair Kimberly Taylor Ann
Bought by
Xie Zheng and Chan May Guen
Home Financials for this Owner
Home Financials are based on the most recent Mortgage that was taken out on this home.
Original Mortgage
$256,000
Interest Rate
6.8%
Create a Home Valuation Report for This Property
The Home Valuation Report is an in-depth analysis detailing your home's value as well as a comparison with similar homes in the area
Home Values in the Area
Average Home Value in this Area
Purchase History
| Date | Buyer | Sale Price | Title Company |
|---|---|---|---|
| Zinn James | $440,000 | Premier Title | |
| Macinnes Susan E | -- | Attorney | |
| Macinnes Susan E | $345,000 | Fidelity National Title | |
| Fergusson Brent | $330,000 | None Available | |
| Xie Zheng | $320,000 | Ticor Title Insurance |
Source: Public Records
Mortgage History
| Date | Status | Borrower | Loan Amount |
|---|---|---|---|
| Previous Owner | Fergusson Brent | $70,000 | |
| Previous Owner | Xie Zheng | $256,000 |
Source: Public Records
Tax History
| Year | Tax Paid | Tax Assessment Tax Assessment Total Assessment is a certain percentage of the fair market value that is determined by local assessors to be the total taxable value of land and additions on the property. | Land | Improvement |
|---|---|---|---|---|
| 2025 | $6,776 | $38,000 | $4,762 | $33,238 |
| 2024 | $6,776 | $38,000 | $4,762 | $33,238 |
| 2023 | $6,582 | $32,000 | $3,840 | $28,160 |
| 2022 | $6,582 | $32,000 | $3,840 | $28,160 |
| 2021 | $6,435 | $32,000 | $3,840 | $28,160 |
| 2020 | $5,702 | $28,698 | $3,072 | $25,626 |
| 2019 | $5,578 | $31,194 | $3,072 | $28,122 |
| 2018 | $5,483 | $31,194 | $3,072 | $28,122 |
| 2017 | $5,308 | $28,034 | $2,534 | $25,500 |
| 2016 | $5,615 | $28,034 | $2,534 | $25,500 |
| 2015 | $5,137 | $28,034 | $2,534 | $25,500 |
| 2014 | $4,824 | $25,998 | $2,073 | $23,925 |
| 2013 | $4,250 | $25,998 | $2,073 | $23,925 |
Source: Public Records
Map
Nearby Homes
- 1000 E 53rd St Unit 219S
- 5200 S Ellis Ave Unit 202
- 5200 S Ellis Ave Unit 117
- 5230 S University Ave Unit D
- 1112 E 52nd St Unit 1
- 5133 S Greenwood Ave Unit 2
- 5142 S Greenwood Ave Unit 1
- 5343 S Drexel Ave
- 5252 S Drexel Ave Unit 2B
- 5118 S Ingleside Ave Unit A
- 5124 S University Ave
- 947 E Hyde Park Blvd Unit G
- 5132 S Drexel Ave Unit 2D
- 1059 E Hyde Park Blvd Unit 1
- 840 E 52nd St Unit 1E
- 838 E 52nd St Unit 1W
- 5424 S Ingleside Ave
- 836 E 52nd St
- 5200 S Woodlawn Ave
- 5319 S Maryland Ave
- 5220 S Berkeley Ave Unit E
- 5220 S Berkeley Ave
- 5220 S Berkeley Ave
- 5220 S Berkeley Ave
- 5220 S Berkeley Ave
- 5220 S Berkeley Ave
- 5220 S Berkeley Ave Unit C
- 5220 S Berkeley Ave Unit F
- 5220 S Berkeley Ave Unit A
- 5222 S Berkeley Ave
- 5226 S Berkeley Ave
- 5226 S Berkeley Ave Unit C
- 5226 S Berkeley Ave Unit A
- 5224 S Berkeley Ave
- 5228 S Berkeley Ave
- 5230 S Berkeley Ave
- 5230 S Berkeley Ave Unit 5239
- 5232 S Berkeley Ave
- 5234 S Berkeley Ave
- 5216 S Berkeley Ave
Your Personal Tour Guide
Ask me questions while you tour the home.