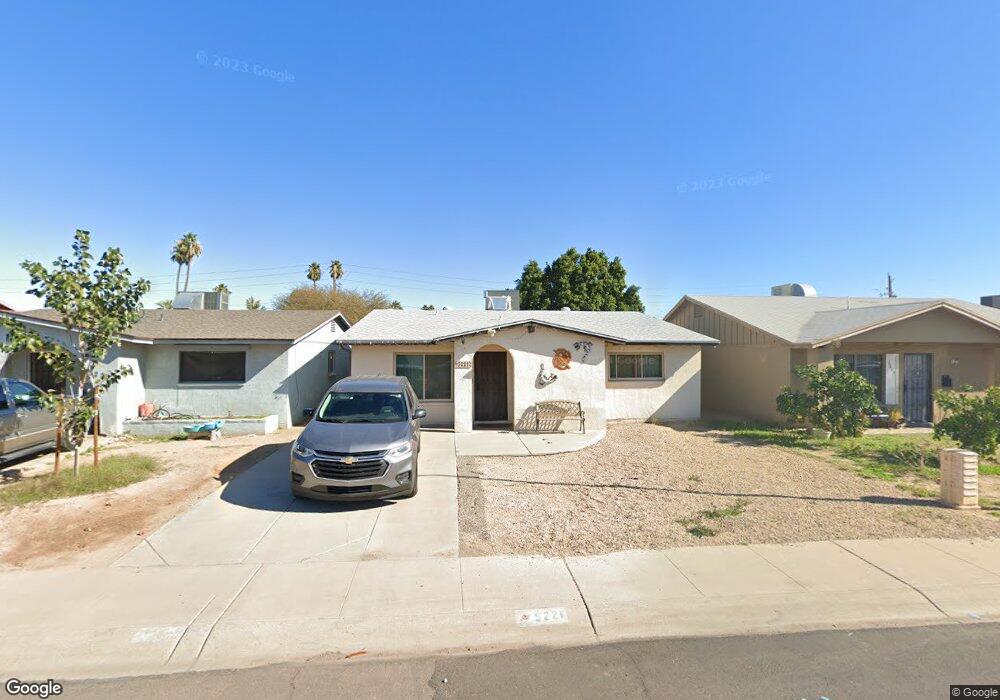
5221 N 41st Ave Phoenix, AZ 85019
Alhambra NeighborhoodEstimated Value: $268,280 - $343,000
Studio
2
Baths
1,512
Sq Ft
$206/Sq Ft
Est. Value
About This Home
This home is located at 5221 N 41st Ave, Phoenix, AZ 85019 and is currently estimated at $311,320, approximately $205 per square foot. 5221 N 41st Ave is a home located in Maricopa County with nearby schools including Sevilla Elementary School East, Sevilla Elementary School West, and Alhambra High School.
Ownership History
Date
Name
Owned For
Owner Type
Purchase Details
Closed on
Jan 20, 2022
Sold by
Prehara Ellen L and Prehara Ellen L
Bought by
Prehara Ellen L and Aguilera Julieanna
Current Estimated Value
Purchase Details
Closed on
Jan 22, 1996
Sold by
Prehara Robert Wayne
Bought by
Prehara Ellen Louise
Create a Home Valuation Report for This Property
The Home Valuation Report is an in-depth analysis detailing your home's value as well as a comparison with similar homes in the area
Home Values in the Area
Average Home Value in this Area
Purchase History
| Date | Buyer | Sale Price | Title Company |
|---|---|---|---|
| Prehara Ellen L | -- | None Listed On Document | |
| Prehara Robert W | -- | None Listed On Document | |
| Prehara Ellen Louise | -- | -- |
Source: Public Records
Tax History
| Year | Tax Paid | Tax Assessment Tax Assessment Total Assessment is a certain percentage of the fair market value that is determined by local assessors to be the total taxable value of land and additions on the property. | Land | Improvement |
|---|---|---|---|---|
| 2025 | $718 | $5,042 | -- | -- |
| 2024 | $652 | $4,802 | -- | -- |
| 2023 | $652 | $22,970 | $4,590 | $18,380 |
| 2022 | $642 | $17,350 | $3,470 | $13,880 |
| 2021 | $654 | $14,150 | $2,830 | $11,320 |
| 2020 | $627 | $12,950 | $2,590 | $10,360 |
| 2019 | $620 | $11,030 | $2,200 | $8,830 |
| 2018 | $567 | $9,960 | $1,990 | $7,970 |
| 2017 | $561 | $7,970 | $1,590 | $6,380 |
| 2016 | $536 | $6,800 | $1,360 | $5,440 |
| 2015 | $509 | $5,750 | $1,150 | $4,600 |
Source: Public Records
Map
Nearby Homes
- 4112 W Pasadena Ave
- 4031 W Denton Ln
- 5221 N 42nd Ln Unit 578
- 5212 N 42nd Ln Unit 592
- 5039 N 40th Ave
- 4035 W Mesquite Ln
- 5203 N 42nd Dr Unit 604
- 5202 N 42nd Dr Unit 608
- 4035 W Reade Ave
- 5035 N 39th Dr
- 5205 N 42nd Pkwy Unit 614
- 4002 W Palomino Rd
- 5002 N 41st Ave
- 3928 W Camelback Rd
- 3936 W Camelback Rd
- 5524 N 39th Ave
- 4117 W San Juan Ave
- 4019 W San Miguel Ave
- 5610 N 38th Dr Unit 3
- 4750 N 39th Dr
- 5223 N 41st Ave
- 5217 N 41st Ave
- 5225 N 41st Ave
- 5215 N 41st Ave
- 5229 N 41st Ave
- 5211 N 41st Ave
- 5231 N 41st Ave
- 5214 N 40th Dr
- 5220 N 40th Dr
- 5208 N 40th Dr
- 5218 N 41st Ave
- 5226 N 41st Ave
- 5207 N 41st Ave
- 5235 N 41st Ave
- 5216 N 41st Ave
- 5212 N 41st Ave
- 4105 W Colter St
- 5202 N 40th Dr
- 5205 N 41st Ave
- 5224 N 40th Dr
Your Personal Tour Guide
Ask me questions while you tour the home.