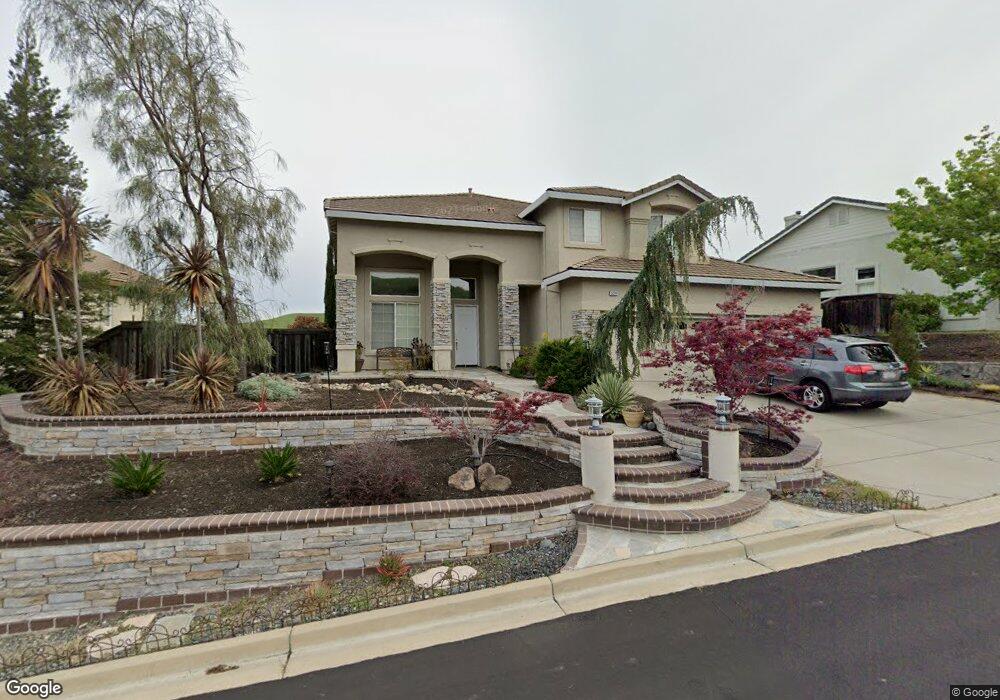
5224 Keller Ridge Dr Clayton, CA 94517
Estimated Value: $1,280,098 - $1,408,000
5
Beds
3
Baths
2,843
Sq Ft
$472/Sq Ft
Est. Value
About This Home
This home is located at 5224 Keller Ridge Dr, Clayton, CA 94517 and is currently estimated at $1,341,275, approximately $471 per square foot. 5224 Keller Ridge Dr is a home located in Contra Costa County with nearby schools including Mt. Diablo Elementary School, Diablo View Middle School, and College Park High School.
Ownership History
Date
Name
Owned For
Owner Type
Purchase Details
Closed on
Oct 29, 2021
Sold by
Nikoui Ghamsari Hooshmand and Slezak Theresa A
Bought by
Nikoui Ghamsari Ihooshmand and Slezak Theresa A
Current Estimated Value
Purchase Details
Closed on
Jan 17, 2003
Sold by
Nikoui Ghamsari Hooshmand and Slezak Theresa A
Bought by
Nikoui Ghamsari Hooshmand and Slezak Theresa A
Home Financials for this Owner
Home Financials are based on the most recent Mortgage that was taken out on this home.
Original Mortgage
$482,000
Outstanding Balance
$195,863
Interest Rate
5.37%
Mortgage Type
Purchase Money Mortgage
Estimated Equity
$1,145,412
Purchase Details
Closed on
May 11, 1999
Sold by
Presley Homes
Bought by
Nikoui Hooshmand and Slezak Theresa A
Home Financials for this Owner
Home Financials are based on the most recent Mortgage that was taken out on this home.
Original Mortgage
$329,300
Interest Rate
6.92%
Mortgage Type
Purchase Money Mortgage
Create a Home Valuation Report for This Property
The Home Valuation Report is an in-depth analysis detailing your home's value as well as a comparison with similar homes in the area
Home Values in the Area
Average Home Value in this Area
Purchase History
| Date | Buyer | Sale Price | Title Company |
|---|---|---|---|
| Nikoui Ghamsari Ihooshmand | -- | None Available | |
| Nikoui Ghamsari Hooshmand | -- | First American Title | |
| Nikoui Hooshmand | $412,000 | North American Title Co |
Source: Public Records
Mortgage History
| Date | Status | Borrower | Loan Amount |
|---|---|---|---|
| Open | Nikoui Ghamsari Hooshmand | $482,000 | |
| Closed | Nikoui Hooshmand | $329,300 |
Source: Public Records
Tax History Compared to Growth
Tax History
| Year | Tax Paid | Tax Assessment Tax Assessment Total Assessment is a certain percentage of the fair market value that is determined by local assessors to be the total taxable value of land and additions on the property. | Land | Improvement |
|---|---|---|---|---|
| 2025 | $8,222 | $645,248 | $266,500 | $378,748 |
| 2024 | $8,062 | $632,597 | $261,275 | $371,322 |
| 2023 | $8,062 | $620,194 | $256,152 | $364,042 |
| 2022 | $8,060 | $608,034 | $251,130 | $356,904 |
| 2021 | $7,943 | $596,112 | $246,206 | $349,906 |
| 2019 | $7,992 | $578,433 | $238,904 | $339,529 |
| 2018 | $7,711 | $567,092 | $234,220 | $332,872 |
| 2017 | $7,474 | $555,974 | $229,628 | $326,346 |
| 2016 | $7,285 | $545,074 | $225,126 | $319,948 |
| 2015 | $7,211 | $536,888 | $221,745 | $315,143 |
| 2014 | $7,099 | $526,372 | $217,402 | $308,970 |
Source: Public Records
Map
Nearby Homes
- 7016 Molluk Way
- 1021 Pebble Beach Dr
- 1023 Pebble Beach Dr
- 1105 Peacock Creek Dr
- 1040 Pebble Beach Dr
- 1343 Shell Ln
- 1295 Shell Cir Unit 1
- 1338 Shell Ln
- 1398 Shell Ln
- 1183 Shell Ln
- 1221 Buckeye Terrace
- 1280 Shell Cir
- 1224 Easley Dr
- 1923 Eagle Peak Ave
- 1921 Eagle Peak Ave Unit 28
- 1039 Feather Cir
- 1731 Indian Wells Way
- 337 Saclan Terrace
- 814 Chert Place
- 415 Chupcan Place Unit 3
- 5222 Keller Ridge Dr
- 5226 Keller Ridge Dr
- 8027 Kelok Way
- 5225 Keller Ridge Dr
- 5220 Keller Ridge Dr
- 5223 Keller Ridge Dr
- 5230 Keller Ridge Dr
- 8025 Kelok Way
- 5221 Keller Ridge Dr
- 5218 Keller Ridge Dr
- 8023 Kelok Way
- 5229 Keller Ridge Dr
- 5219 Keller Ridge Dr
- 8037 Kelok Way
- 8030 Kelok Way
- 8021 Kelok Way
- 8032 Kelok Way
- 5217 Keller Ridge Dr
- 5216 Keller Ridge Dr
- 8028 Kelok Way