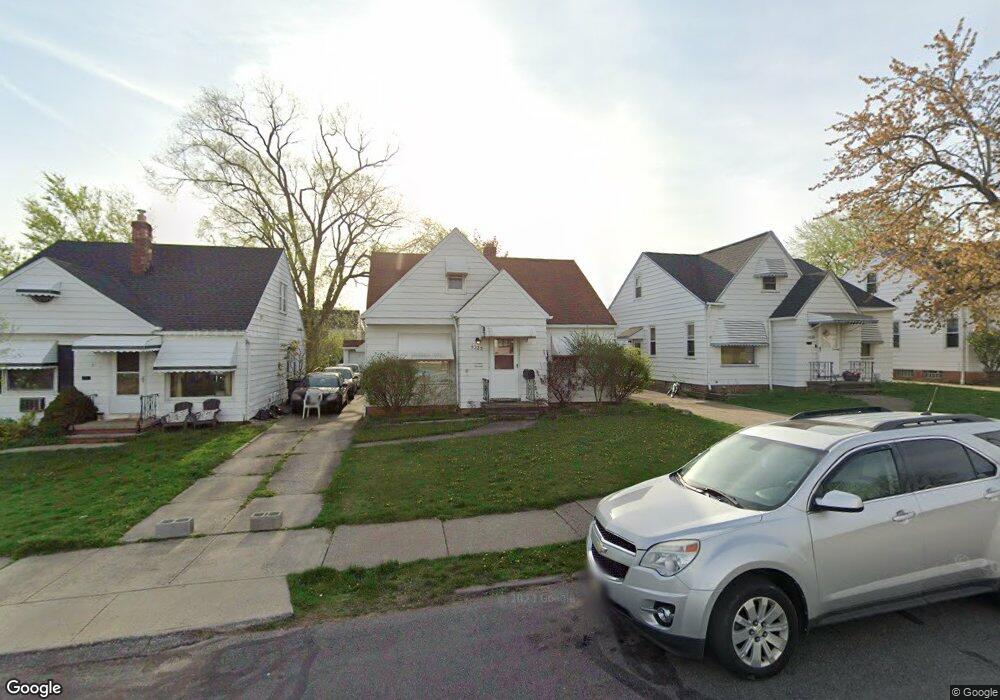
5225 E 113th St Cleveland, OH 44125
Estimated Value: $123,000 - $145,000
2
Beds
1
Bath
1,306
Sq Ft
$100/Sq Ft
Est. Value
About This Home
This home is located at 5225 E 113th St, Cleveland, OH 44125 and is currently estimated at $130,524, approximately $99 per square foot. 5225 E 113th St is a home located in Cuyahoga County with nearby schools including Garfield Heights High School, North Shore High School, and St Benedict Catholic School.
Ownership History
Date
Name
Owned For
Owner Type
Purchase Details
Closed on
Oct 28, 1997
Sold by
Kainec Bernard J
Bought by
Kainec Bernard J and Kainec Carol L
Current Estimated Value
Purchase Details
Closed on
Jul 31, 1991
Sold by
Morgan Alan S and Morgan Theresa V
Bought by
Kainec Bernard J
Purchase Details
Closed on
Feb 23, 1983
Sold by
Richard J Collingwood
Bought by
Morgan Alan S and Morgan Theresa
Purchase Details
Closed on
Sep 14, 1979
Sold by
Collingwood Richard J
Bought by
Richard J Collingwood
Purchase Details
Closed on
Mar 22, 1978
Sold by
Makovicka Mildred
Bought by
Collingwood Richard J
Purchase Details
Closed on
Feb 8, 1978
Sold by
Kwiatkowski Stella
Bought by
Makovicka Mildred
Purchase Details
Closed on
Jan 1, 1975
Bought by
Kwiatkowski Stella
Create a Home Valuation Report for This Property
The Home Valuation Report is an in-depth analysis detailing your home's value as well as a comparison with similar homes in the area
Home Values in the Area
Average Home Value in this Area
Purchase History
| Date | Buyer | Sale Price | Title Company |
|---|---|---|---|
| Kainec Bernard J | $72,000 | -- | |
| Kainec Bernard J | $67,000 | -- | |
| Morgan Alan S | $51,000 | -- | |
| Richard J Collingwood | -- | -- | |
| Collingwood Richard J | $40,000 | -- | |
| Makovicka Mildred | -- | -- | |
| Kwiatkowski Stella | -- | -- |
Source: Public Records
Mortgage History
| Date | Status | Borrower | Loan Amount |
|---|---|---|---|
| Closed | Kainec Bernard J | -- |
Source: Public Records
Tax History Compared to Growth
Tax History
| Year | Tax Paid | Tax Assessment Tax Assessment Total Assessment is a certain percentage of the fair market value that is determined by local assessors to be the total taxable value of land and additions on the property. | Land | Improvement |
|---|---|---|---|---|
| 2024 | $4,207 | $40,285 | $7,420 | $32,865 |
| 2023 | $3,076 | $26,990 | $4,620 | $22,370 |
| 2022 | $3,033 | $26,990 | $4,620 | $22,370 |
| 2021 | $3,206 | $26,990 | $4,620 | $22,370 |
| 2020 | $2,817 | $22,120 | $3,780 | $18,340 |
| 2019 | $2,793 | $63,200 | $10,800 | $52,400 |
| 2018 | $2,908 | $22,120 | $3,780 | $18,340 |
| 2017 | $2,816 | $20,900 | $3,500 | $17,400 |
| 2016 | $2,856 | $20,900 | $3,500 | $17,400 |
| 2015 | $3,145 | $20,900 | $3,500 | $17,400 |
| 2014 | $3,145 | $25,480 | $4,270 | $21,210 |
Source: Public Records
Map
Nearby Homes
- 11100 Wallingford Ave
- 11013 Lincoln Ave
- 5139 E 114th St
- 5293 E 115th St
- 5204 Turney Rd
- 11509 Granger Rd
- 10925 Thornton Ave
- 11016 Mccracken Rd
- 11520 Granger Rd
- 11006 Mccracken Rd
- 11703 Granger Rd
- 10916 Mccracken Rd
- 11206 Park Heights Ave
- 10417 Grace Ave
- 10420 S Highland Ave
- 10609 Mccracken Blvd
- 10717 Park Heights Ave
- 10408 S Highland Ave
- 10401 Grace Ave
- 11105 Vernon Ave
- 5229 E 113th St
- 5221 E 113th St
- 5233 E 113th St
- 5217 E 113th St
- 5224 E 114th St
- 5228 E 114th St
- 5220 E 114th St
- 5237 E 113th St
- 5213 E 113th St
- 5232 E 114th St
- 5216 E 114th St
- 5224 E 113th St
- 5209 E 113th St
- 5236 E 114th St
- 5228 E 113th St
- 5212 E 114th St
- 5220 E 113th St
- 5234 E 113th St
- 5240 E 114th St
- 5208 E 114th St