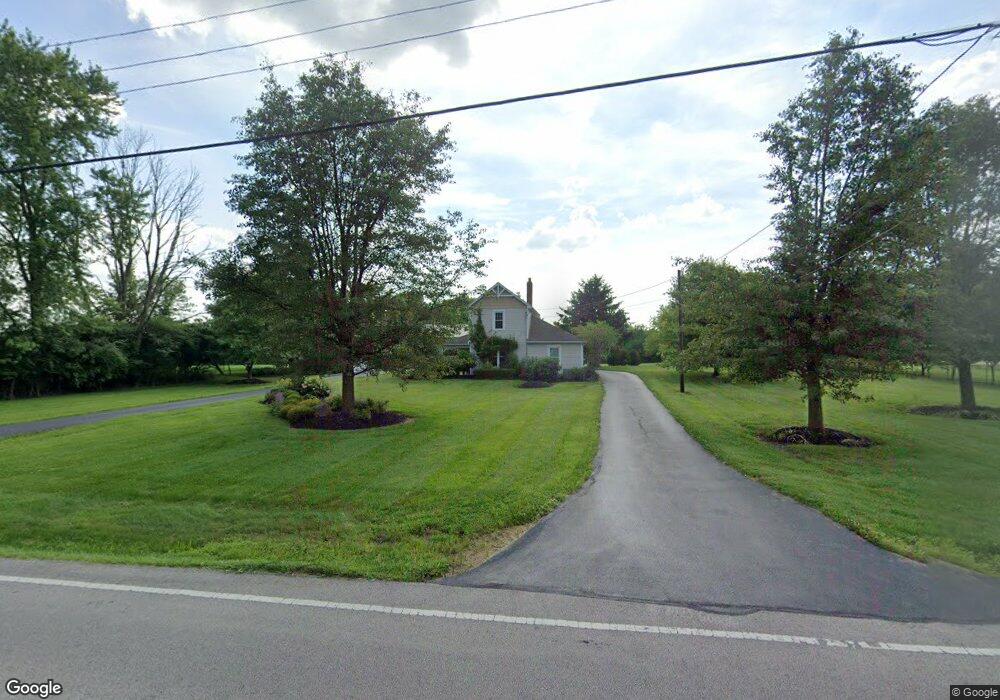
5227 Union Rd Clayton, OH 45315
Estimated Value: $186,000 - $231,000
3
Beds
1
Bath
1,148
Sq Ft
$187/Sq Ft
Est. Value
About This Home
This home is located at 5227 Union Rd, Clayton, OH 45315 and is currently estimated at $214,230, approximately $186 per square foot. 5227 Union Rd is a home located in Montgomery County with nearby schools including Trotwood-Madison Middle School, Trotwood-Madison High School, and Trotwood Preparatory & Fitness Academy.
Ownership History
Date
Name
Owned For
Owner Type
Purchase Details
Closed on
Jan 25, 2011
Sold by
Ambrose Maria R
Bought by
Crosley Joseph J
Current Estimated Value
Purchase Details
Closed on
May 21, 2004
Sold by
Crosley Joseph J
Bought by
Crosley Joseph J and Ambrose Maria R
Home Financials for this Owner
Home Financials are based on the most recent Mortgage that was taken out on this home.
Original Mortgage
$80,850
Interest Rate
5.91%
Mortgage Type
New Conventional
Purchase Details
Closed on
May 14, 2004
Sold by
Klopf Adam J and Klopf Sara Shipman
Bought by
Crosley Joseph J
Home Financials for this Owner
Home Financials are based on the most recent Mortgage that was taken out on this home.
Original Mortgage
$80,850
Interest Rate
5.91%
Mortgage Type
New Conventional
Create a Home Valuation Report for This Property
The Home Valuation Report is an in-depth analysis detailing your home's value as well as a comparison with similar homes in the area
Home Values in the Area
Average Home Value in this Area
Purchase History
| Date | Buyer | Sale Price | Title Company |
|---|---|---|---|
| Crosley Joseph J | -- | Attorney | |
| Crosley Joseph J | -- | -- | |
| Crosley Joseph J | $105,000 | -- |
Source: Public Records
Mortgage History
| Date | Status | Borrower | Loan Amount |
|---|---|---|---|
| Previous Owner | Crosley Joseph J | $80,850 |
Source: Public Records
Tax History Compared to Growth
Tax History
| Year | Tax Paid | Tax Assessment Tax Assessment Total Assessment is a certain percentage of the fair market value that is determined by local assessors to be the total taxable value of land and additions on the property. | Land | Improvement |
|---|---|---|---|---|
| 2024 | $3,921 | $60,120 | $20,630 | $39,490 |
| 2023 | $3,921 | $60,120 | $20,630 | $39,490 |
| 2022 | $3,338 | $39,810 | $13,660 | $26,150 |
| 2021 | $3,344 | $39,810 | $13,660 | $26,150 |
| 2020 | $3,338 | $39,810 | $13,660 | $26,150 |
| 2019 | $3,010 | $32,160 | $12,300 | $19,860 |
| 2018 | $2,905 | $31,010 | $12,300 | $18,710 |
| 2017 | $2,886 | $31,010 | $12,300 | $18,710 |
| 2016 | $2,811 | $30,210 | $13,660 | $16,550 |
| 2015 | $2,764 | $30,210 | $13,660 | $16,550 |
| 2014 | $2,764 | $30,210 | $13,660 | $16,550 |
| 2012 | -- | $30,250 | $13,660 | $16,590 |
Source: Public Records
Map
Nearby Homes
- 6440 Westanna Dr
- 6473 Waywind Dr
- 6459 Waywind Dr
- 6331 Westford Rd
- 0 Breckenridge Trail Unit 1040231
- 6200 Weybridge Dr
- 2017 Ivy Rd
- 5619 Moss Creek Blvd
- 1003 Redwood Rd
- Spruce Plan at Hunters Path
- Walnut Plan at Hunters Path
- Ashton Plan at Hunters Path
- Empress Plan at Hunters Path
- Chestnut Plan at Hunters Path
- Cooper Plan at Hunters Path
- Juniper Plan at Hunters Path
- Norway Plan at Hunters Path
- Aspen II Plan at Hunters Path
- Ironwood Plan at Hunters Path
- Palmetto Plan at Hunters Path