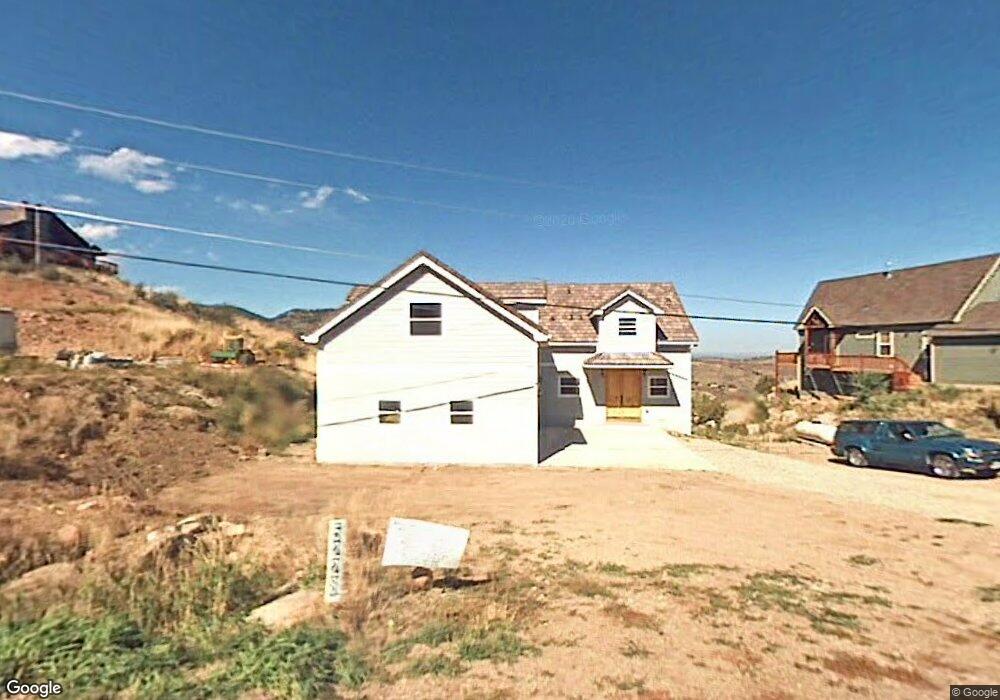
5228 Arrowhead Ln Fort Collins, CO 80526
Estimated Value: $764,000 - $967,000
4
Beds
5
Baths
3,480
Sq Ft
$251/Sq Ft
Est. Value
About This Home
This home is located at 5228 Arrowhead Ln, Fort Collins, CO 80526 and is currently estimated at $873,976, approximately $251 per square foot. 5228 Arrowhead Ln is a home located in Larimer County with nearby schools including McGraw Elementary School, Webber Middle School, and Rocky Mountain High School.
Ownership History
Date
Name
Owned For
Owner Type
Purchase Details
Closed on
Sep 4, 2019
Sold by
Carlson Michael O
Bought by
Hollinger Reed and Hollinger Katilyn
Current Estimated Value
Home Financials for this Owner
Home Financials are based on the most recent Mortgage that was taken out on this home.
Original Mortgage
$436,000
Outstanding Balance
$382,682
Interest Rate
3.7%
Mortgage Type
New Conventional
Estimated Equity
$491,294
Purchase Details
Closed on
Mar 25, 2005
Sold by
Boccio Linda C
Bought by
Carlson Michael O
Home Financials for this Owner
Home Financials are based on the most recent Mortgage that was taken out on this home.
Original Mortgage
$228,736
Interest Rate
5.71%
Mortgage Type
Construction
Purchase Details
Closed on
Aug 2, 2001
Sold by
Labelle David
Bought by
Boccio Linda C
Purchase Details
Closed on
Jul 1, 1993
Sold by
Labelle David
Bought by
Labelle David
Create a Home Valuation Report for This Property
The Home Valuation Report is an in-depth analysis detailing your home's value as well as a comparison with similar homes in the area
Home Values in the Area
Average Home Value in this Area
Purchase History
| Date | Buyer | Sale Price | Title Company |
|---|---|---|---|
| Hollinger Reed | $545,000 | First American | |
| Carlson Michael O | -- | Chicago Title Co | |
| Boccio Linda C | $36,000 | -- | |
| Labelle David | -- | -- |
Source: Public Records
Mortgage History
| Date | Status | Borrower | Loan Amount |
|---|---|---|---|
| Open | Hollinger Reed | $436,000 | |
| Previous Owner | Carlson Michael O | $228,736 |
Source: Public Records
Tax History Compared to Growth
Tax History
| Year | Tax Paid | Tax Assessment Tax Assessment Total Assessment is a certain percentage of the fair market value that is determined by local assessors to be the total taxable value of land and additions on the property. | Land | Improvement |
|---|---|---|---|---|
| 2025 | $5,243 | $55,824 | $9,715 | $46,109 |
| 2024 | $4,994 | $55,824 | $9,715 | $46,109 |
| 2022 | $3,978 | $40,087 | $4,830 | $35,257 |
| 2021 | $4,005 | $41,241 | $4,969 | $36,272 |
| 2020 | $3,821 | $38,968 | $4,433 | $34,535 |
| 2019 | $4,780 | $48,641 | $4,433 | $44,208 |
| 2018 | $4,024 | $42,113 | $4,464 | $37,649 |
| 2017 | $4,001 | $42,113 | $4,464 | $37,649 |
| 2016 | $3,663 | $38,319 | $4,935 | $33,384 |
| 2015 | $3,630 | $38,320 | $4,940 | $33,380 |
| 2014 | $2,914 | $30,500 | $4,540 | $25,960 |
Source: Public Records
Map
Nearby Homes
- 5017 Overhill Dr
- 4809 Foothills Dr
- 5000 Foothills Dr
- 4789 W County Road 38 E
- 4801 W County Road 38 E Unit 2
- 4633 Canyon View Dr
- 4529 Shoreline Dr Unit 6
- 4808 Brookside Dr
- 4841 Deer Trail Ct
- 4402 Kano Dr
- 4904 Deer Trail Ct
- 4217 Edith Dr
- 4908 Thompson Heights Dr
- 4412 Ann St
- 4136 Edith Dr
- 4109 Edith Dr
- 5817 Harrison Dr
- 9360 Gold Mine Rd
- 3300 Continental Cir
- 9680 W County Road 38 E
- 5228 Arrowhead Ln
- 5224 Arrowhead Ln
- 5232 Arrowhead Ln
- 5220 Arrowhead Ln
- 5016 Overhill Dr
- 4701 W County Road 38e
- 5229 Arrowhead Ln
- 5216 Arrowhead Ln
- 5221 Arrowhead Ln
- 5020 Overhill Dr
- 5321 W Crestview Ln
- 5233 Arrowhead Ln
- 5212 Arrowhead Ln
- 5213 Arrowhead Ln
- 5329 W Crestview Ln
- 5208 Arrowhead Ln
- 5105 Arrowhead Ln
- 5116 Arrowhead Ln
- 5209 Arrowhead Ln
- 5313 W Crestview Ln