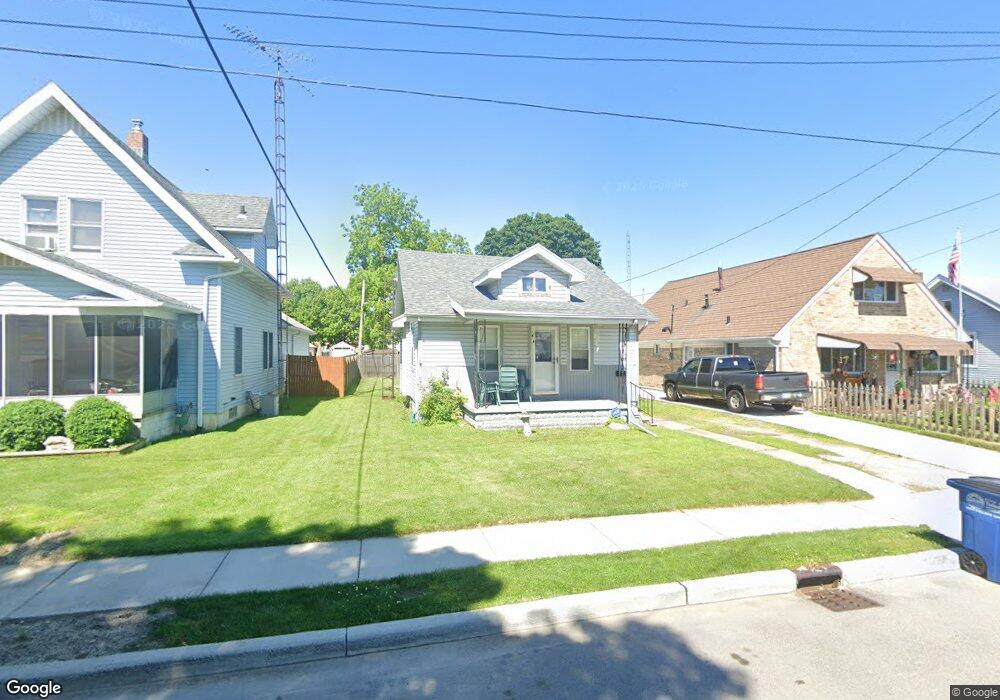
5229 302nd St Toledo, OH 43611
Point Place NeighborhoodEstimated Value: $95,727 - $117,000
3
Beds
1
Bath
1,238
Sq Ft
$85/Sq Ft
Est. Value
About This Home
This home is located at 5229 302nd St, Toledo, OH 43611 and is currently estimated at $105,182, approximately $84 per square foot. 5229 302nd St is a home located in Lucas County with nearby schools including Edgewater Elementary School, Woodward High School, and Imagine Environmental Science Academy.
Ownership History
Date
Name
Owned For
Owner Type
Purchase Details
Closed on
Jul 22, 2024
Sold by
Sniadecki Michael H
Bought by
Dr3 Realty Llc
Current Estimated Value
Home Financials for this Owner
Home Financials are based on the most recent Mortgage that was taken out on this home.
Original Mortgage
$72,000
Outstanding Balance
$71,118
Interest Rate
6.86%
Mortgage Type
Credit Line Revolving
Estimated Equity
$34,064
Purchase Details
Closed on
Dec 19, 1990
Purchase Details
Closed on
Jul 12, 1990
Sold by
Lambdin B J and K J
Create a Home Valuation Report for This Property
The Home Valuation Report is an in-depth analysis detailing your home's value as well as a comparison with similar homes in the area
Home Values in the Area
Average Home Value in this Area
Purchase History
| Date | Buyer | Sale Price | Title Company |
|---|---|---|---|
| Dr3 Realty Llc | $90,000 | None Listed On Document | |
| -- | -- | -- | |
| -- | -- | -- |
Source: Public Records
Mortgage History
| Date | Status | Borrower | Loan Amount |
|---|---|---|---|
| Open | Dr3 Realty Llc | $72,000 |
Source: Public Records
Tax History Compared to Growth
Tax History
| Year | Tax Paid | Tax Assessment Tax Assessment Total Assessment is a certain percentage of the fair market value that is determined by local assessors to be the total taxable value of land and additions on the property. | Land | Improvement |
|---|---|---|---|---|
| 2024 | $756 | $23,835 | $6,090 | $17,745 |
| 2023 | $1,280 | $19,075 | $5,355 | $13,720 |
| 2022 | $1,281 | $19,075 | $5,355 | $13,720 |
| 2021 | $1,309 | $19,075 | $5,355 | $13,720 |
| 2020 | $1,432 | $18,515 | $4,690 | $13,825 |
| 2019 | $1,392 | $18,515 | $4,690 | $13,825 |
| 2018 | $1,410 | $18,515 | $4,690 | $13,825 |
| 2017 | $1,433 | $18,095 | $4,585 | $13,510 |
| 2016 | $1,433 | $51,700 | $13,100 | $38,600 |
| 2015 | $1,421 | $51,700 | $13,100 | $38,600 |
| 2014 | $1,170 | $18,100 | $4,590 | $13,510 |
| 2013 | $1,170 | $18,100 | $4,590 | $13,510 |
Source: Public Records
Map
Nearby Homes