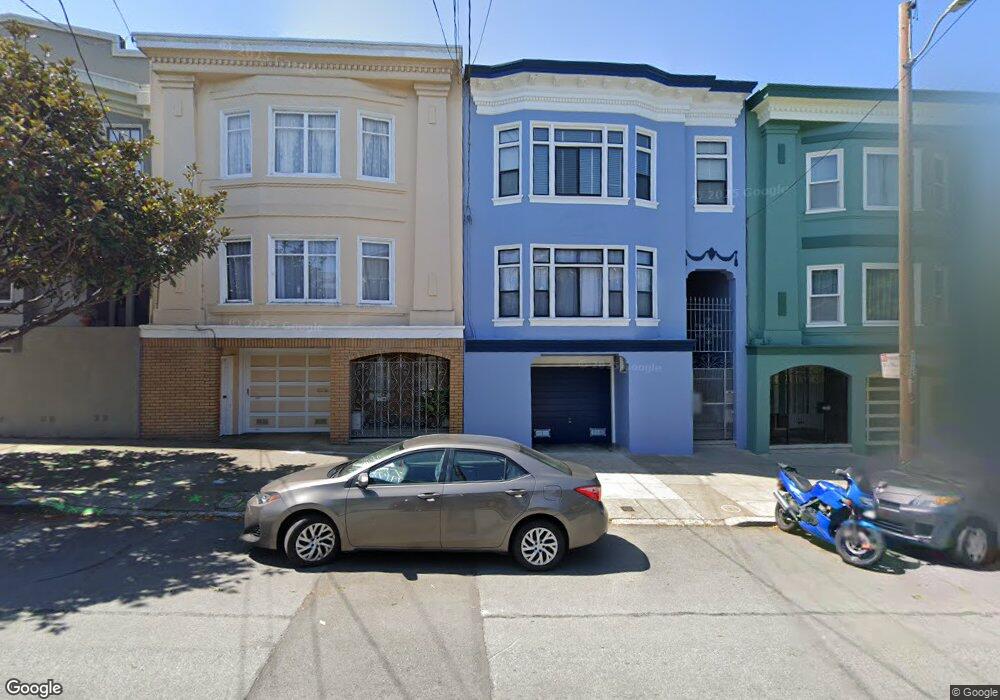
523 18th Ave Unit 525 San Francisco, CA 94121
Central Richmond NeighborhoodEstimated Value: $1,643,000 - $1,976,166
--
Bed
2
Baths
3,648
Sq Ft
$515/Sq Ft
Est. Value
About This Home
This home is located at 523 18th Ave Unit 525, San Francisco, CA 94121 and is currently estimated at $1,879,542, approximately $515 per square foot. 523 18th Ave Unit 525 is a home located in San Francisco County with nearby schools including Argonne Elementary School, Presidio Middle School, and Stratford School - San Francisco 14th Avenue.
Ownership History
Date
Name
Owned For
Owner Type
Purchase Details
Closed on
Jun 11, 2024
Sold by
Gee Chuck Yu Chui
Bought by
Chuck Yu Chui Gee Revocable Trust and Gee
Current Estimated Value
Purchase Details
Closed on
Jan 17, 2024
Sold by
1999 Rose Sue H Wong Revocable Trust
Bought by
Gee Chuck Yu Chui
Purchase Details
Closed on
Jun 8, 2007
Sold by
2000 Rose Sue H Wong Family Lp
Bought by
Wong Rose Sue H
Purchase Details
Closed on
Sep 11, 2000
Sold by
Wong Rose Sue H and Gee Chuck Yu Chui
Bought by
2000 Rose Sue H Wong Family Ltd Prtnrshp
Purchase Details
Closed on
Oct 26, 1999
Sold by
Wong Rose Sue H Revocable Tr and Rose Sue H
Bought by
Gee Chuck Yu Chui
Purchase Details
Closed on
Aug 14, 1995
Sold by
Wong Sue Hang
Bought by
Wong Sue Hang
Purchase Details
Closed on
Aug 22, 1994
Sold by
Wong Sue Hang and Gee Chuckley Y
Bought by
Wong Sue Hang
Create a Home Valuation Report for This Property
The Home Valuation Report is an in-depth analysis detailing your home's value as well as a comparison with similar homes in the area
Home Values in the Area
Average Home Value in this Area
Purchase History
| Date | Buyer | Sale Price | Title Company |
|---|---|---|---|
| Chuck Yu Chui Gee Revocable Trust | -- | None Listed On Document | |
| Gee Chuck Yu Chui | -- | None Listed On Document | |
| Wong Rose Sue H | -- | None Available | |
| 2000 Rose Sue H Wong Family Ltd Prtnrshp | -- | -- | |
| Wong Rose Sue H | -- | -- | |
| Gee Chuck Yu Chui | -- | -- | |
| Wong Rose Sue H | -- | -- | |
| Wong Sue Hang | -- | -- | |
| Wong Sue Hang | -- | -- |
Source: Public Records
Tax History Compared to Growth
Tax History
| Year | Tax Paid | Tax Assessment Tax Assessment Total Assessment is a certain percentage of the fair market value that is determined by local assessors to be the total taxable value of land and additions on the property. | Land | Improvement |
|---|---|---|---|---|
| 2025 | $3,651 | $868,051 | $587,299 | $280,752 |
| 2024 | $3,651 | $307,364 | $146,606 | $160,758 |
| 2023 | $3,681 | $301,343 | $143,734 | $157,609 |
| 2022 | $3,617 | $295,439 | $140,917 | $154,522 |
| 2021 | $3,556 | $289,649 | $138,155 | $151,494 |
| 2020 | $3,616 | $286,684 | $136,740 | $149,944 |
| 2019 | $3,497 | $281,067 | $134,060 | $147,007 |
| 2018 | $3,380 | $275,561 | $131,433 | $144,128 |
| 2017 | $3,342 | $270,162 | $128,857 | $141,305 |
| 2016 | $3,260 | $264,869 | $126,333 | $138,536 |
| 2015 | $3,219 | $260,895 | $124,438 | $136,457 |
| 2014 | $3,136 | $255,789 | $122,002 | $133,787 |
Source: Public Records
Map
Nearby Homes
- 1608 Balboa St
- 516 15th Ave Unit 518
- 518 15th Ave
- 609 15th Ave
- 1532 Cabrillo St
- 1633 Cabrillo St
- 428 15th Ave
- 2133 Balboa St
- 1827 Clement St
- 756 18th Ave Unit 756
- 368 Funston Ave
- 2205 Clement St
- 459 11th Ave
- 700 12th Ave Unit 6
- 1940 Anza St Unit 6
- 172 18th Ave
- 576 27th Ave
- 1014 Clement St
- 2443 Clement St Unit 4
- 511 9th Ave