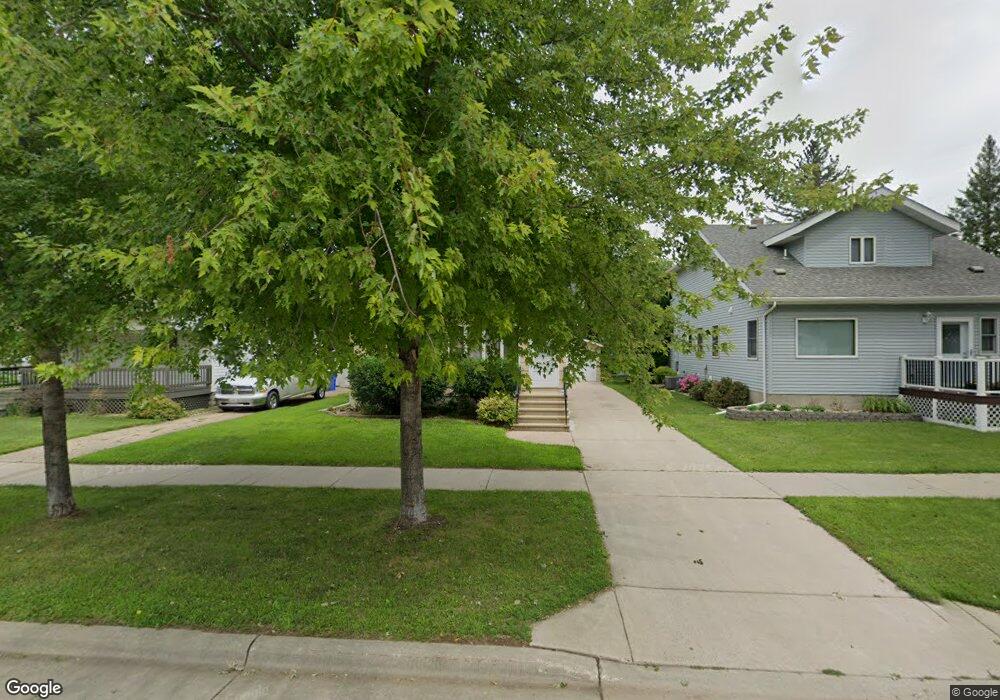
523 2nd St NW Pipestone, MN 56164
Estimated Value: $148,000 - $231,000
3
Beds
1
Bath
--
Sq Ft
6,316
Sq Ft
About This Home
This home is located at 523 2nd St NW, Pipestone, MN 56164 and is currently estimated at $170,916. 523 2nd St NW is a home located in Pipestone County with nearby schools including Pipestone Elementary School, Brown Elementary School, and Pipestone Head Start.
Ownership History
Date
Name
Owned For
Owner Type
Purchase Details
Closed on
Jul 1, 2024
Sold by
Cheryll Sobrecary and Kroening James W
Bought by
Garcia Joshua J
Current Estimated Value
Home Financials for this Owner
Home Financials are based on the most recent Mortgage that was taken out on this home.
Original Mortgage
$136,000
Outstanding Balance
$134,360
Interest Rate
6.94%
Mortgage Type
New Conventional
Estimated Equity
$36,556
Purchase Details
Closed on
Apr 22, 2019
Sold by
Pistachio Lisa R and Pistachio Lisa Rose
Bought by
Kroening James W and Kroening Cheryll S
Home Financials for this Owner
Home Financials are based on the most recent Mortgage that was taken out on this home.
Original Mortgage
$64,000
Interest Rate
4.3%
Mortgage Type
New Conventional
Purchase Details
Closed on
Sep 12, 2005
Sold by
Rood Dianne C and Schreader Dianne C
Bought by
Tulio Lisa R
Home Financials for this Owner
Home Financials are based on the most recent Mortgage that was taken out on this home.
Original Mortgage
$68,000
Interest Rate
5.93%
Create a Home Valuation Report for This Property
The Home Valuation Report is an in-depth analysis detailing your home's value as well as a comparison with similar homes in the area
Home Values in the Area
Average Home Value in this Area
Purchase History
| Date | Buyer | Sale Price | Title Company |
|---|---|---|---|
| Garcia Joshua J | $160,000 | Pipestone Abstract & Title | |
| Kroening James W | $69,000 | None Available | |
| Tulio Lisa R | -- | -- |
Source: Public Records
Mortgage History
| Date | Status | Borrower | Loan Amount |
|---|---|---|---|
| Open | Garcia Joshua J | $136,000 | |
| Previous Owner | Kroening James W | $64,000 | |
| Previous Owner | Tulio Lisa R | $68,000 |
Source: Public Records
Tax History
| Year | Tax Paid | Tax Assessment Tax Assessment Total Assessment is a certain percentage of the fair market value that is determined by local assessors to be the total taxable value of land and additions on the property. | Land | Improvement |
|---|---|---|---|---|
| 2025 | $44 | $130,300 | $6,200 | $124,100 |
| 2024 | $44 | $106,100 | $6,200 | $99,900 |
| 2023 | $1,128 | $95,600 | $6,200 | $89,400 |
| 2022 | $1,044 | $79,900 | $4,400 | $75,500 |
| 2021 | $1,092 | $70,400 | $4,400 | $66,000 |
| 2020 | $1,236 | $73,400 | $4,400 | $69,000 |
| 2019 | $1,162 | $82,100 | $3,500 | $78,600 |
| 2018 | $1,058 | $78,100 | $3,500 | $74,600 |
| 2017 | $1,078 | $71,500 | $3,500 | $68,000 |
| 2016 | $936 | $0 | $0 | $0 |
| 2015 | $758 | $38,100 | $2,160 | $35,940 |
| 2014 | $758 | $38,300 | $2,158 | $36,142 |
Source: Public Records
Map
Nearby Homes
Your Personal Tour Guide
Ask me questions while you tour the home.