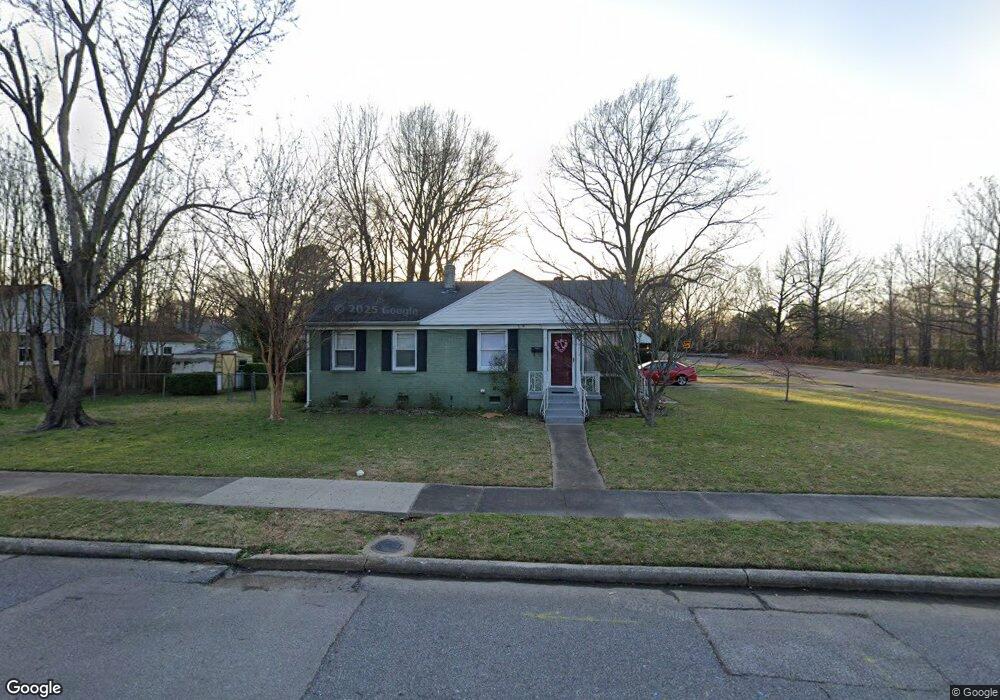
523 Grahamwood Dr Memphis, TN 38122
High Point Terrace NeighborhoodEstimated Value: $205,409 - $251,000
3
Beds
2
Baths
1,140
Sq Ft
$202/Sq Ft
Est. Value
About This Home
This home is located at 523 Grahamwood Dr, Memphis, TN 38122 and is currently estimated at $230,102, approximately $201 per square foot. 523 Grahamwood Dr is a home located in Shelby County with nearby schools including Grahamwood Elementary School, White Station Middle, and White Station High.
Ownership History
Date
Name
Owned For
Owner Type
Purchase Details
Closed on
May 30, 2019
Sold by
Wallace Stanley
Bought by
Wallace Community Property Trust
Current Estimated Value
Purchase Details
Closed on
Sep 26, 2006
Sold by
Millikin Patricia S and Millikin Patrick D
Bought by
Wallace Stanley
Home Financials for this Owner
Home Financials are based on the most recent Mortgage that was taken out on this home.
Original Mortgage
$85,600
Outstanding Balance
$6,787
Interest Rate
6.48%
Mortgage Type
Purchase Money Mortgage
Estimated Equity
$223,315
Purchase Details
Closed on
Apr 27, 2006
Sold by
Millikin Robert H
Bought by
Millikin Patricia S and Millikin Patrick D
Purchase Details
Closed on
Aug 8, 2005
Sold by
Thomason Robert W
Bought by
Milliken Robert
Purchase Details
Closed on
Jul 18, 2005
Sold by
Thomason Jacquelyn D
Bought by
Thomason Robert W
Purchase Details
Closed on
Oct 20, 2000
Sold by
Thomason Robert W and Thomason Mary F
Bought by
Thomason Jacquelyn D
Create a Home Valuation Report for This Property
The Home Valuation Report is an in-depth analysis detailing your home's value as well as a comparison with similar homes in the area
Home Values in the Area
Average Home Value in this Area
Purchase History
| Date | Buyer | Sale Price | Title Company |
|---|---|---|---|
| Wallace Community Property Trust | -- | None Available | |
| Wallace Stanley | $107,000 | None Available | |
| Millikin Patricia S | -- | None Available | |
| Milliken Robert | $82,000 | Realty Title & Escrow Co Inc | |
| Thomason Robert W | -- | -- | |
| Thomason Jacquelyn D | -- | -- | |
| Thomason Jacquelyn D | -- | -- |
Source: Public Records
Mortgage History
| Date | Status | Borrower | Loan Amount |
|---|---|---|---|
| Open | Wallace Stanley | $85,600 |
Source: Public Records
Tax History Compared to Growth
Tax History
| Year | Tax Paid | Tax Assessment Tax Assessment Total Assessment is a certain percentage of the fair market value that is determined by local assessors to be the total taxable value of land and additions on the property. | Land | Improvement |
|---|---|---|---|---|
| 2025 | $1,603 | $47,100 | $10,875 | $36,225 |
| 2024 | $1,603 | $47,300 | $7,250 | $40,050 |
| 2023 | $2,881 | $47,300 | $7,250 | $40,050 |
| 2022 | $2,881 | $47,300 | $7,250 | $40,050 |
| 2021 | $2,915 | $47,300 | $7,250 | $40,050 |
| 2020 | $2,422 | $33,425 | $7,250 | $26,175 |
| 2019 | $1,068 | $33,425 | $7,250 | $26,175 |
| 2018 | $1,068 | $33,425 | $7,250 | $26,175 |
| 2017 | $1,094 | $33,425 | $7,250 | $26,175 |
| 2016 | $1,335 | $30,550 | $0 | $0 |
| 2014 | $1,335 | $30,550 | $0 | $0 |
Source: Public Records
Map
Nearby Homes
- 428 E Swan Ridge Cir
- 599 Isabelle St
- 3749 Shirlwood Ave
- 3727 N Swan Ridge Cir
- 3688 Philwood Ave
- 3697 Shirlwood Ave
- 4023 Hilldale Ave
- 3815 Montclair Dr
- 3811 S Montclair Dr
- 3882 Tutwiler Ave
- 3634 Autumn Ave
- 501 Gerald Rd
- 3725 Tutwiler Ave
- 273 Saint Andrews Fairway
- 779 Chatwood Cove
- 781 Chatwood Cove
- 791 Chatwood Cove
- 458 Gerald Rd
- 294 Aurora Cir
- 473 Vaughn Rd
- 3869 Meade Ave
- 513 Grahamwood Dr
- 522 Grahamwood Dr
- 507 Grahamwood Dr
- 520 Lytle St
- 512 Lytle St
- 508 Lytle St
- 510 Grahamwood Dr
- 501 Grahamwood Dr
- 3901 Meade Ave
- 504 Grahamwood Dr
- 500 Lytle St
- 493 Grahamwood Dr
- 3903 Meade Ave
- 494 Lytle St
- 509 Adrian Dr
- 517 Lytle St
- 521 Lytle St
- 511 Lytle St
- 501 Adrian Dr