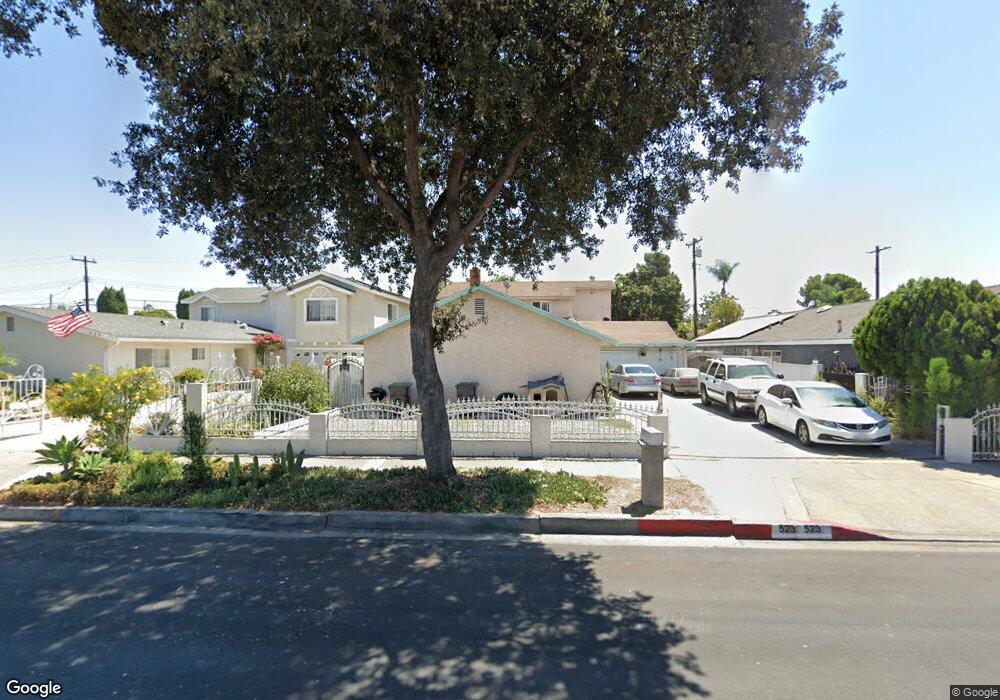
523 Jenkins St Santa Ana, CA 92703
Riverview West NeighborhoodEstimated Value: $784,000 - $1,169,345
10
Beds
6
Baths
2,988
Sq Ft
$321/Sq Ft
Est. Value
About This Home
This home is located at 523 Jenkins St, Santa Ana, CA 92703 and is currently estimated at $958,836, approximately $320 per square foot. 523 Jenkins St is a home located in Orange County with nearby schools including Rosita Elementary School, James Irvine Intermediate School, and Los Amigos High School.
Ownership History
Date
Name
Owned For
Owner Type
Purchase Details
Closed on
May 8, 2012
Sold by
Explore Investments Llc
Bought by
Phan Anh N
Current Estimated Value
Purchase Details
Closed on
Dec 10, 2009
Sold by
Jenkins Trust #523
Bought by
Explore Investments Llc
Purchase Details
Closed on
Aug 14, 2009
Sold by
Doan Nhat V
Bought by
Jenkins Trust #523 and Ttr Investments Inc
Purchase Details
Closed on
Aug 5, 2003
Sold by
Thantrong Tuan and Thantrong Susan Nghiem
Bought by
Doan Nhat
Home Financials for this Owner
Home Financials are based on the most recent Mortgage that was taken out on this home.
Original Mortgage
$320,000
Interest Rate
5.17%
Mortgage Type
Purchase Money Mortgage
Purchase Details
Closed on
May 18, 1998
Sold by
Tuan Thantrong and Tuan Xuan N
Bought by
Thantrong Tuan and Thantrong Xuan Nghiem
Create a Home Valuation Report for This Property
The Home Valuation Report is an in-depth analysis detailing your home's value as well as a comparison with similar homes in the area
Home Values in the Area
Average Home Value in this Area
Purchase History
| Date | Buyer | Sale Price | Title Company |
|---|---|---|---|
| Phan Anh N | $193,000 | Advantage Title Inc | |
| Explore Investments Llc | $312,000 | First American Title Company | |
| Jenkins Trust #523 | -- | None Available | |
| Doan Nhat | $443,000 | Fidelity National Title Co | |
| Thantrong Tuan | -- | Southland Title Corporation |
Source: Public Records
Mortgage History
| Date | Status | Borrower | Loan Amount |
|---|---|---|---|
| Previous Owner | Doan Nhat | $320,000 |
Source: Public Records
Tax History Compared to Growth
Tax History
| Year | Tax Paid | Tax Assessment Tax Assessment Total Assessment is a certain percentage of the fair market value that is determined by local assessors to be the total taxable value of land and additions on the property. | Land | Improvement |
|---|---|---|---|---|
| 2025 | $5,398 | $458,854 | $322,772 | $136,082 |
| 2024 | $5,398 | $449,857 | $316,443 | $133,414 |
| 2023 | $5,299 | $441,037 | $310,238 | $130,799 |
| 2022 | $5,181 | $432,390 | $304,155 | $128,235 |
| 2021 | $5,110 | $423,912 | $298,191 | $125,721 |
| 2020 | $5,048 | $419,566 | $295,134 | $124,432 |
| 2019 | $4,982 | $411,340 | $289,347 | $121,993 |
| 2018 | $4,858 | $403,275 | $283,674 | $119,601 |
| 2017 | $4,811 | $395,368 | $278,112 | $117,256 |
| 2016 | $4,599 | $387,616 | $272,659 | $114,957 |
| 2015 | $4,539 | $381,794 | $268,563 | $113,231 |
| 2014 | $4,432 | $374,316 | $263,303 | $111,013 |
Source: Public Records
Map
Nearby Homes
- 4832 W 5th St Unit B
- 4248 W 5th St
- 4518 W 1st St
- 4201 W 5th St Unit 314
- 323 N Euclid St Unit 99
- 3932 W 5th St Unit 202
- 5114 W 1st St Unit C
- 3929 W 5th St Unit 16
- 5112 W 1st St Unit C
- 5132 W 1st St Unit B
- 5317 Silver Dr
- 14376 Euclid St Unit 1-4
- 1114 N Gates St
- 5405 W 4th St
- 13322 Euclid St
- 10886 Lotus Dr
- 432 S Harbor Blvd Unit 101
- 432 S Harbor Blvd Unit 64
- 432 S Harbor Blvd Unit 7
- 4512 W Watkins Way