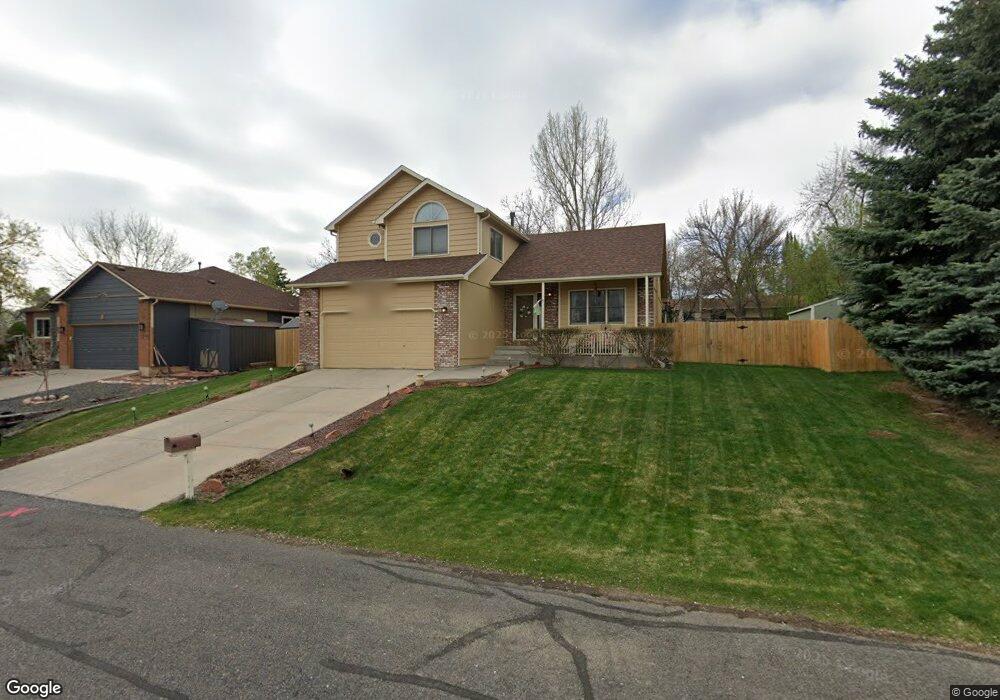
523 Ruby Dr Fort Collins, CO 80525
Estimated Value: $507,000 - $578,000
3
Beds
3
Baths
1,839
Sq Ft
$296/Sq Ft
Est. Value
About This Home
This home is located at 523 Ruby Dr, Fort Collins, CO 80525 and is currently estimated at $544,967, approximately $296 per square foot. 523 Ruby Dr is a home located in Larimer County with nearby schools including Cottonwood Plains Elementary School, Lucile Erwin Middle School, and Loveland High School.
Ownership History
Date
Name
Owned For
Owner Type
Purchase Details
Closed on
Jun 13, 2003
Sold by
Jensen Harris R
Bought by
Stout Steven D and Stout Michelle T
Current Estimated Value
Home Financials for this Owner
Home Financials are based on the most recent Mortgage that was taken out on this home.
Original Mortgage
$174,400
Outstanding Balance
$68,788
Interest Rate
4.87%
Mortgage Type
Unknown
Estimated Equity
$476,179
Purchase Details
Closed on
Oct 29, 1999
Sold by
Mount Rhonda Louise
Bought by
Jensen Harris R
Home Financials for this Owner
Home Financials are based on the most recent Mortgage that was taken out on this home.
Original Mortgage
$139,900
Interest Rate
7.85%
Purchase Details
Closed on
Mar 1, 1995
Sold by
Valdez Benny Ray
Bought by
Mount Rhonda Louise
Purchase Details
Closed on
Dec 1, 1993
Sold by
Bjjs Inc
Bought by
Apple Homes Inc
Purchase Details
Closed on
Mar 1, 1993
Sold by
Apple Homes Inc
Bought by
Tracy Evelyn M
Create a Home Valuation Report for This Property
The Home Valuation Report is an in-depth analysis detailing your home's value as well as a comparison with similar homes in the area
Purchase History
| Date | Buyer | Sale Price | Title Company |
|---|---|---|---|
| Stout Steven D | $218,000 | -- | |
| Jensen Harris R | $174,900 | North American Title Co | |
| Mount Rhonda Louise | -- | -- | |
| Apple Homes Inc | -- | -- | |
| Tracy Evelyn M | $94,800 | -- |
Source: Public Records
Mortgage History
| Date | Status | Borrower | Loan Amount |
|---|---|---|---|
| Open | Stout Steven D | $174,400 | |
| Previous Owner | Jensen Harris R | $139,900 |
Source: Public Records
Tax History
| Year | Tax Paid | Tax Assessment Tax Assessment Total Assessment is a certain percentage of the fair market value that is determined by local assessors to be the total taxable value of land and additions on the property. | Land | Improvement |
|---|---|---|---|---|
| 2025 | $2,632 | $31,719 | $1,250 | $30,469 |
| 2024 | $2,544 | $35,376 | $1,340 | $34,036 |
| 2022 | $2,117 | $25,555 | $1,390 | $24,165 |
| 2021 | $2,170 | $26,291 | $1,430 | $24,861 |
| 2020 | $2,136 | $25,862 | $1,430 | $24,432 |
| 2019 | $2,101 | $25,862 | $1,430 | $24,432 |
| 2018 | $1,739 | $20,376 | $1,440 | $18,936 |
| 2017 | $1,506 | $20,376 | $1,440 | $18,936 |
| 2016 | $1,489 | $19,494 | $1,592 | $17,902 |
| 2015 | $1,477 | $19,490 | $1,590 | $17,900 |
| 2014 | $1,408 | $18,000 | $1,590 | $16,410 |
Source: Public Records
Map
Nearby Homes
- 412 Park Place
- 512 Carpenter Rd
- 413 Park Place
- 734 Victoria Dr
- 7108 Shadow Ridge Dr
- 505 Coyote Trail Dr
- 946 Snowy Plain Rd
- 714 Fairbourne Way
- 918 Cub Ct
- 120 Triangle Dr
- 6908 Autumn Ridge Dr
- 8402 Dome Ct
- 7144 Woodrow Dr
- 8510 Bruns Dr
- 6815 S College Ave
- 7009 Egyptian Dr
- 7039 Woodrow Dr
- 517 E Trilby Rd Unit 33
- 517 E Trilby Rd Unit 26
- 6621 Desert Willow Way Unit 1
Your Personal Tour Guide
Ask me questions while you tour the home.