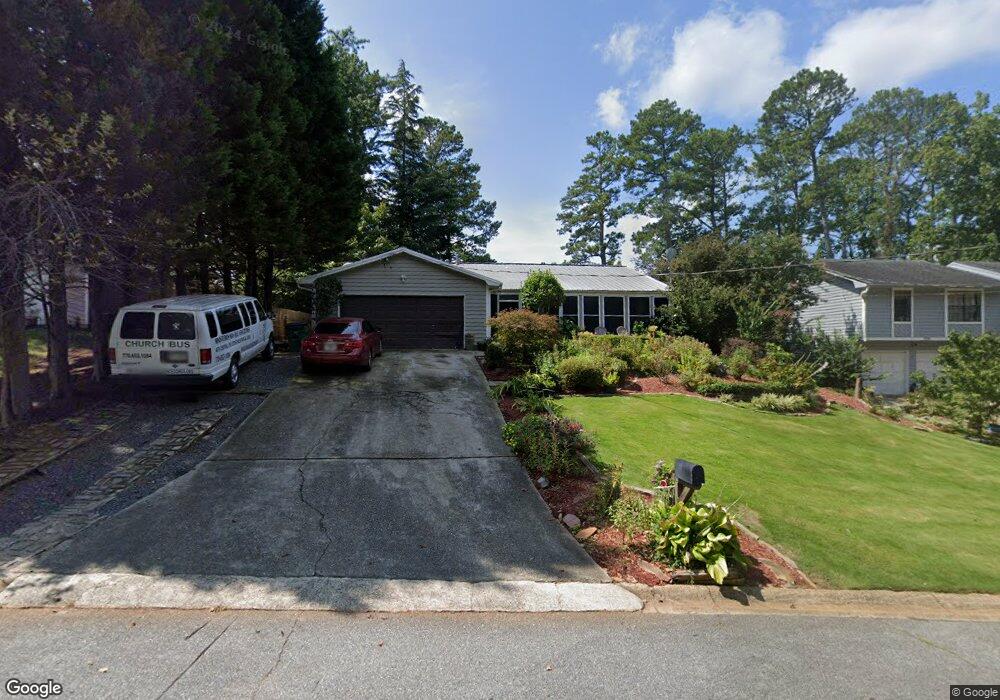
5232 Downs Ln Unit 3 Norcross, GA 30093
Estimated Value: $332,000 - $351,000
4
Beds
2
Baths
1,676
Sq Ft
$203/Sq Ft
Est. Value
About This Home
This home is located at 5232 Downs Ln Unit 3, Norcross, GA 30093 and is currently estimated at $340,717, approximately $203 per square foot. 5232 Downs Ln Unit 3 is a home located in Gwinnett County with nearby schools including Meadowcreek Elementary School, Louise Radloff Middle School, and Meadowcreek High School.
Ownership History
Date
Name
Owned For
Owner Type
Purchase Details
Closed on
Jan 17, 2022
Sold by
Figueroa Jose A
Bought by
Gonzalez Cecilia Duarte
Current Estimated Value
Purchase Details
Closed on
Jan 23, 2003
Sold by
Kooymans William G and Kooymans Joyce T
Bought by
Figueroa Jose A
Home Financials for this Owner
Home Financials are based on the most recent Mortgage that was taken out on this home.
Original Mortgage
$141,818
Interest Rate
5.98%
Mortgage Type
FHA
Purchase Details
Closed on
Feb 25, 2002
Sold by
Haissling Jae R
Bought by
Kooymans William G and Kooymans Joyce T
Home Financials for this Owner
Home Financials are based on the most recent Mortgage that was taken out on this home.
Original Mortgage
$75,000
Interest Rate
6.41%
Mortgage Type
New Conventional
Purchase Details
Closed on
Dec 17, 2001
Sold by
Haussling Douglas R
Bought by
Haussling Jae R
Create a Home Valuation Report for This Property
The Home Valuation Report is an in-depth analysis detailing your home's value as well as a comparison with similar homes in the area
Home Values in the Area
Average Home Value in this Area
Purchase History
| Date | Buyer | Sale Price | Title Company |
|---|---|---|---|
| Gonzalez Cecilia Duarte | -- | -- | |
| Figueroa Jose A | $143,000 | -- | |
| Kooymans William G | $105,000 | -- | |
| Haussling Jae R | -- | -- |
Source: Public Records
Mortgage History
| Date | Status | Borrower | Loan Amount |
|---|---|---|---|
| Previous Owner | Figueroa Jose A | $141,818 | |
| Previous Owner | Kooymans William G | $75,000 |
Source: Public Records
Tax History Compared to Growth
Tax History
| Year | Tax Paid | Tax Assessment Tax Assessment Total Assessment is a certain percentage of the fair market value that is determined by local assessors to be the total taxable value of land and additions on the property. | Land | Improvement |
|---|---|---|---|---|
| 2025 | $4,980 | $129,720 | $21,120 | $108,600 |
| 2024 | $4,770 | $122,520 | $21,120 | $101,400 |
| 2023 | $4,770 | $110,560 | $23,200 | $87,360 |
| 2022 | $3,820 | $97,400 | $14,400 | $83,000 |
| 2021 | $2,888 | $70,240 | $14,400 | $55,840 |
| 2020 | $2,902 | $70,240 | $14,400 | $55,840 |
| 2019 | $2,414 | $59,360 | $11,200 | $48,160 |
| 2018 | $2,411 | $59,360 | $11,200 | $48,160 |
| 2016 | $1,975 | $46,400 | $8,800 | $37,600 |
| 2015 | $1,646 | $36,560 | $6,400 | $30,160 |
| 2014 | -- | $36,560 | $6,400 | $30,160 |
Source: Public Records
Map
Nearby Homes
- 1413 Silver Lake Dr
- 5345 Seattle Slew Ct Unit 3
- 1133 Sandune Dr
- 1461 Silver Lake Dr
- 5333 Bishops Cir
- 5341 Woodbin Dr
- 5271 Williams Rd Unit A-1
- 1437 Roman Point Dr
- 1013 Sandune Dr
- 5431 Village Green Square Unit 1018
- 5425 Village Green Square Unit 3
- 897 Six Oaks Cir Unit B
- 936 Six Oaks Cir Unit B
- 5605 Rock Place Ct
- 5554 Clover Rise Ln Unit 2
- 5331 Sherwin Dr
- 5323 Sherwin Dr
- 5343 Sherwin Dr Unit 15
- 5238 Downs Ln Unit 3
- 5226 Downs Ln
- 1341 Country Downs Dr
- 1349 Country Downs Dr Unit 2
- 5220 Downs Ln Unit 3
- 5244 Downs Ln
- 1333 Country Downs Dr Unit 1
- 1357 Country Downs Dr Unit 2
- 5231 Downs Ln
- 5225 Downs Ln
- 5237 Downs Ln Unit 3
- 5214 Downs Ln
- 5250 Downs Ln
- 1325 Country Downs Dr
- 5219 Downs Ln Unit 3
- 1365 Country Downs Dr Unit 2
- 5243 Downs Ln
- 5213 Downs Ln Unit 3
- 1317 Country Downs Dr
- 5249 Downs Ln