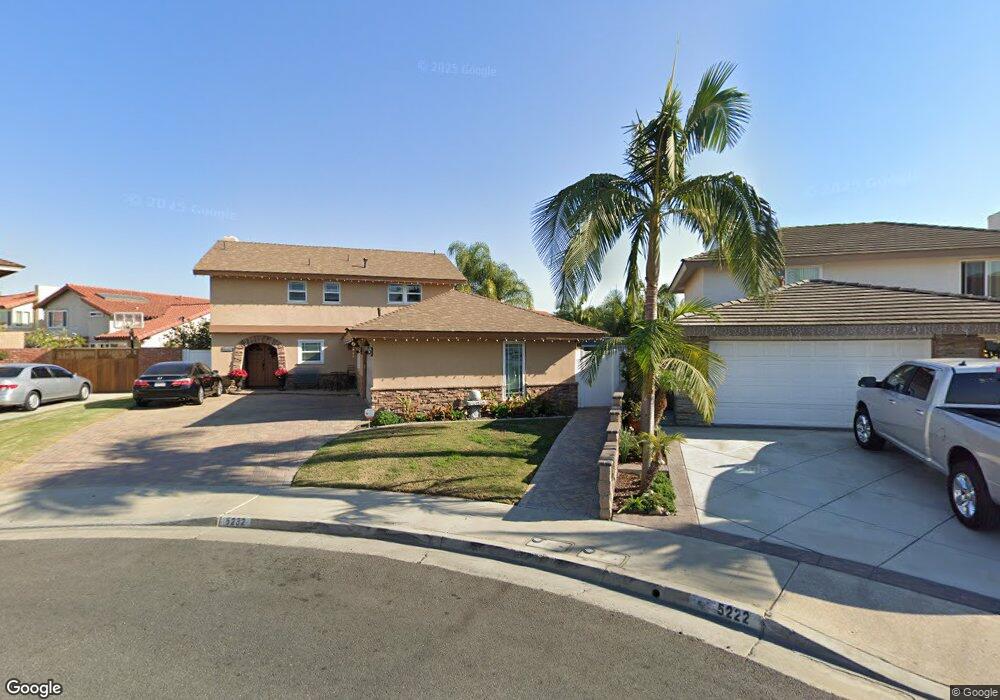
5232 Huntswood Cir La Palma, CA 90623
Estimated Value: $1,102,000 - $1,246,243
4
Beds
3
Baths
1,880
Sq Ft
$636/Sq Ft
Est. Value
About This Home
This home is located at 5232 Huntswood Cir, La Palma, CA 90623 and is currently estimated at $1,195,811, approximately $636 per square foot. 5232 Huntswood Cir is a home located in Orange County with nearby schools including Los Coyotes Elementary School, Walker Junior High School, and John F. Kennedy High School.
Ownership History
Date
Name
Owned For
Owner Type
Purchase Details
Closed on
Nov 2, 2012
Sold by
Nizami Mobin I and Nizami Shahida M
Bought by
Nizami Mobin I and Nizami Shahida M
Current Estimated Value
Home Financials for this Owner
Home Financials are based on the most recent Mortgage that was taken out on this home.
Original Mortgage
$411,900
Outstanding Balance
$73,033
Interest Rate
3.36%
Mortgage Type
New Conventional
Estimated Equity
$1,122,778
Purchase Details
Closed on
Sep 28, 2006
Sold by
Nizami Mobin I and Nizami Shahida M
Bought by
Nizami Mobin I and Nizami Shahida M
Purchase Details
Closed on
Sep 12, 1997
Sold by
Ray John R and Ray Jennie S
Bought by
Nizami Mobin I and Nizami Shahida M
Home Financials for this Owner
Home Financials are based on the most recent Mortgage that was taken out on this home.
Original Mortgage
$214,600
Interest Rate
7.54%
Purchase Details
Closed on
Dec 22, 1995
Sold by
Ray John R
Bought by
Ray Jennie S
Create a Home Valuation Report for This Property
The Home Valuation Report is an in-depth analysis detailing your home's value as well as a comparison with similar homes in the area
Home Values in the Area
Average Home Value in this Area
Purchase History
| Date | Buyer | Sale Price | Title Company |
|---|---|---|---|
| Nizami Mobin I | -- | Ortc | |
| Nizami Mobin I | -- | None Available | |
| Nizami Mobin I | $244,000 | Commonwealth Land Title | |
| Ray Jennie S | -- | -- |
Source: Public Records
Mortgage History
| Date | Status | Borrower | Loan Amount |
|---|---|---|---|
| Open | Nizami Mobin I | $411,900 | |
| Closed | Nizami Mobin I | $214,600 |
Source: Public Records
Tax History Compared to Growth
Tax History
| Year | Tax Paid | Tax Assessment Tax Assessment Total Assessment is a certain percentage of the fair market value that is determined by local assessors to be the total taxable value of land and additions on the property. | Land | Improvement |
|---|---|---|---|---|
| 2025 | $4,917 | $424,138 | $243,778 | $180,360 |
| 2024 | $4,917 | $415,822 | $238,998 | $176,824 |
| 2023 | $4,794 | $407,669 | $234,312 | $173,357 |
| 2022 | $4,732 | $399,676 | $229,718 | $169,958 |
| 2021 | $4,664 | $391,840 | $225,214 | $166,626 |
| 2020 | $4,636 | $387,823 | $222,905 | $164,918 |
| 2019 | $4,520 | $380,219 | $218,534 | $161,685 |
| 2018 | $4,438 | $372,764 | $214,249 | $158,515 |
| 2017 | $4,298 | $365,455 | $210,048 | $155,407 |
| 2016 | $4,215 | $358,290 | $205,930 | $152,360 |
| 2015 | $4,168 | $352,909 | $202,837 | $150,072 |
| 2014 | $3,959 | $345,996 | $198,863 | $147,133 |
Source: Public Records
Map
Nearby Homes
- 5212 Lena Dr
- 5072 Alder Ln
- 5201 La Luna Dr
- 5568 Ozawa Cir
- 8312 Bellhaven St
- 5166 Banbury Cir
- 7442 Susan Cir
- 5686 Panama Dr
- 8011 Rose St
- 4891 Grace Ave
- 5412 Bransford Dr
- 8606 Belmont St
- 7862 Squaw Valley Way
- 5837 Los Arcos Way
- 8162 Gay St
- 19118 Martha Ave
- 8641 Belmont St Unit 2
- 4772 Grace Ave
- 4502 Petite Ln
- 5612 Sprague Ave
- 5222 Huntswood Cir
- 5252 Van Dyke Cir
- 5231 Huntswood Cir
- 5251 Van Dyke Cir
- 5212 Huntswood Cir
- 5221 Huntswood Cir
- 5262 Van Dyke Cir
- 5241 Ivywood Dr
- 5231 Ivywood Dr
- 5251 Ivywood Dr
- 5221 Ivywood Dr
- 5261 Van Dyke Cir
- 5211 Huntswood Cir
- 5202 Huntswood Cir
- 5211 Ivywood Dr
- 5261 Ivywood Dr
- 5242 Bridgewood Dr
- 5252 Bridgewood Dr
- 5272 Van Dyke Cir
- 5232 Bridgewood Dr