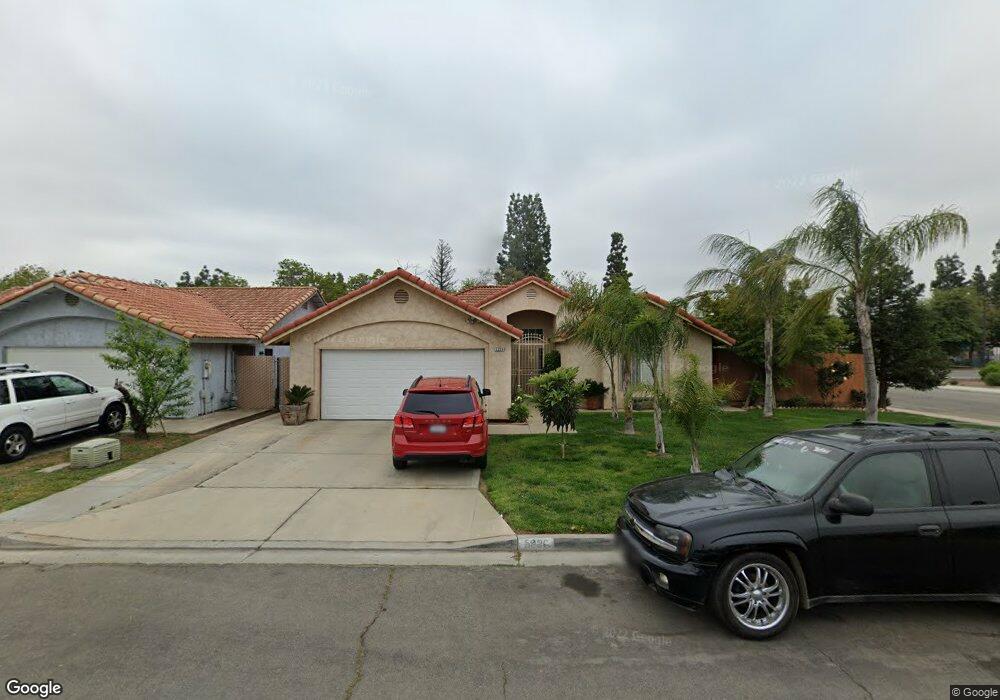
5236 E Hammond Ave Fresno, CA 93727
Roosevelt NeighborhoodEstimated Value: $326,000 - $385,000
3
Beds
2
Baths
1,438
Sq Ft
$242/Sq Ft
Est. Value
About This Home
This home is located at 5236 E Hammond Ave, Fresno, CA 93727 and is currently estimated at $347,905, approximately $241 per square foot. 5236 E Hammond Ave is a home located in Fresno County with nearby schools including Turner Elementary School, Scandinavian Middle School, and Mclane High School.
Ownership History
Date
Name
Owned For
Owner Type
Purchase Details
Closed on
Dec 9, 2005
Sold by
Gonzalez Jose J and Gonzalez Salvador
Bought by
Gonzalez Jose J
Current Estimated Value
Purchase Details
Closed on
Aug 5, 1998
Sold by
Hud
Bought by
Gonzalez Jose J and Gonzalez Salvador
Home Financials for this Owner
Home Financials are based on the most recent Mortgage that was taken out on this home.
Original Mortgage
$79,346
Outstanding Balance
$16,567
Interest Rate
6.93%
Mortgage Type
FHA
Estimated Equity
$331,338
Purchase Details
Closed on
Sep 16, 1997
Sold by
Countrywide Home Loans Inc
Bought by
Hud
Purchase Details
Closed on
Sep 15, 1997
Sold by
Sarin Men and Tan Simon
Bought by
Countrywide Home Loans Inc
Purchase Details
Closed on
Aug 3, 1995
Sold by
Olive Branch Estates
Bought by
Tan Simon and Men Sarin
Home Financials for this Owner
Home Financials are based on the most recent Mortgage that was taken out on this home.
Original Mortgage
$74,386
Interest Rate
7.71%
Mortgage Type
FHA
Create a Home Valuation Report for This Property
The Home Valuation Report is an in-depth analysis detailing your home's value as well as a comparison with similar homes in the area
Home Values in the Area
Average Home Value in this Area
Purchase History
| Date | Buyer | Sale Price | Title Company |
|---|---|---|---|
| Gonzalez Jose J | -- | -- | |
| Gonzalez Jose J | $80,000 | North American Title Co | |
| Hud | -- | First American Title Ins Co | |
| Countrywide Home Loans Inc | $78,120 | First American Title Ins Co | |
| Tan Simon | $97,000 | Central Title Company |
Source: Public Records
Mortgage History
| Date | Status | Borrower | Loan Amount |
|---|---|---|---|
| Open | Gonzalez Jose J | $79,346 | |
| Previous Owner | Tan Simon | $74,386 | |
| Closed | Gonzalez Jose J | $3,343 |
Source: Public Records
Tax History Compared to Growth
Tax History
| Year | Tax Paid | Tax Assessment Tax Assessment Total Assessment is a certain percentage of the fair market value that is determined by local assessors to be the total taxable value of land and additions on the property. | Land | Improvement |
|---|---|---|---|---|
| 2025 | $1,561 | $125,386 | $37,610 | $87,776 |
| 2023 | $1,531 | $120,518 | $36,150 | $84,368 |
| 2022 | $1,509 | $118,156 | $35,442 | $82,714 |
| 2021 | $1,468 | $115,841 | $34,748 | $81,093 |
| 2020 | $1,461 | $114,654 | $34,392 | $80,262 |
| 2019 | $1,406 | $112,407 | $33,718 | $78,689 |
| 2018 | $1,376 | $110,204 | $33,057 | $77,147 |
| 2017 | $1,439 | $108,044 | $32,409 | $75,635 |
| 2016 | $1,308 | $105,926 | $31,774 | $74,152 |
| 2015 | $1,288 | $104,336 | $31,297 | $73,039 |
| 2014 | $1,261 | $102,293 | $30,684 | $71,609 |
Source: Public Records
Map
Nearby Homes
- 1221 N Peach Ave Unit 226
- 5181 E Olive Ave Unit 117
- 1336 N Homsy Ave
- 6523 E Sooner Dr
- 5026 E Lewis Ave
- 5009 E Clay Ave
- 1353 N Adler Ave
- 5060 E Weathermaker Ave
- 1431 N Willow Ave
- 4942 E Oslin Ave
- 342 N Minnewawa Ave
- 4983 E Grant Ave
- 605 N Winery Ave
- 5527 E Grant Ave
- 4923 E Grant Ave
- 5576 E Belmont Ave
- 4843 E Oslin Ave
- 4875 E Mckinley Ave Unit 129
- 1745 N Winery Ave Unit multi
- 1745 N Winery Ave Unit 102
- 5240 E Hammond Ave
- 5246 E Hammond Ave
- 5235 E Hammond Ave
- 5239 E Hammond Ave
- 5250 E Hammond Ave
- 5245 E Hammond Ave
- 5249 E Hammond Ave
- 5254 E Hammond Ave
- 5234 E Hedges Ave
- 5238 E Hedges Ave
- 5244 E Hedges Ave
- 5253 E Hammond Ave
- 1234 N Peach Ave
- 5248 E Hedges Ave
- 5260 E Hammond Ave
- 5250 E Olive Ave
- 5259 E Hammond Ave
- 5252 E Hedges Ave
- 5210 E Olive Ave
- 5263 E Hammond Ave