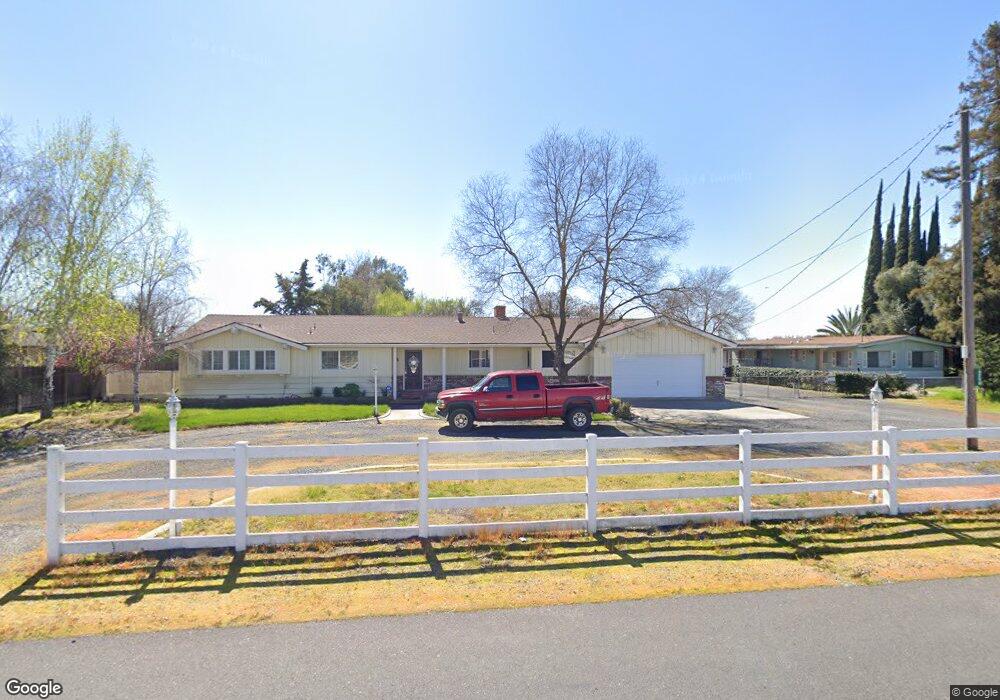
5238 Roeding Rd Hughson, CA 95326
Estimated Value: $629,000 - $804,000
3
Beds
2
Baths
1,738
Sq Ft
$410/Sq Ft
Est. Value
About This Home
This home is located at 5238 Roeding Rd, Hughson, CA 95326 and is currently estimated at $711,758, approximately $409 per square foot. 5238 Roeding Rd is a home located in Stanislaus County with nearby schools including Hughson Elementary School, Fox Road Elementary School, and Emilie J. Ross Middle School.
Ownership History
Date
Name
Owned For
Owner Type
Purchase Details
Closed on
Nov 5, 2009
Sold by
Us Bank National Association
Bought by
Lee David
Current Estimated Value
Home Financials for this Owner
Home Financials are based on the most recent Mortgage that was taken out on this home.
Original Mortgage
$200,000
Outstanding Balance
$129,459
Interest Rate
4.91%
Mortgage Type
New Conventional
Estimated Equity
$582,299
Purchase Details
Closed on
Aug 25, 2009
Sold by
Garcia Miguel
Bought by
Us Bank National Association
Purchase Details
Closed on
Oct 12, 2007
Sold by
Garcia Miguel
Bought by
Garcia Teresa
Purchase Details
Closed on
Jun 14, 2006
Sold by
Birmley Robert D
Bought by
Garcia Miguel
Home Financials for this Owner
Home Financials are based on the most recent Mortgage that was taken out on this home.
Original Mortgage
$550,000
Interest Rate
6.63%
Mortgage Type
Unknown
Create a Home Valuation Report for This Property
The Home Valuation Report is an in-depth analysis detailing your home's value as well as a comparison with similar homes in the area
Purchase History
| Date | Buyer | Sale Price | Title Company |
|---|---|---|---|
| Lee David | $295,000 | First American Title Company | |
| Us Bank National Association | $250,000 | Accommodation | |
| Garcia Teresa | -- | None Available | |
| Garcia Miguel | $735,000 | Fidelity Natl Title Co Of Ca |
Source: Public Records
Mortgage History
| Date | Status | Borrower | Loan Amount |
|---|---|---|---|
| Open | Lee David | $200,000 | |
| Previous Owner | Garcia Miguel | $550,000 |
Source: Public Records
Tax History
| Year | Tax Paid | Tax Assessment Tax Assessment Total Assessment is a certain percentage of the fair market value that is determined by local assessors to be the total taxable value of land and additions on the property. | Land | Improvement |
|---|---|---|---|---|
| 2025 | $4,287 | $368,931 | $162,898 | $206,033 |
| 2024 | $4,023 | $361,698 | $159,704 | $201,994 |
| 2023 | $3,828 | $354,607 | $156,573 | $198,034 |
| 2022 | $3,767 | $347,654 | $153,503 | $194,151 |
| 2021 | $3,695 | $340,839 | $150,494 | $190,345 |
| 2020 | $3,640 | $337,345 | $148,951 | $188,394 |
| 2019 | $3,603 | $330,731 | $146,031 | $184,700 |
| 2018 | $3,494 | $324,247 | $143,168 | $181,079 |
| 2017 | $3,523 | $317,890 | $140,361 | $177,529 |
| 2016 | $3,321 | $311,658 | $137,609 | $174,049 |
| 2015 | $3,266 | $306,977 | $135,542 | $171,435 |
| 2014 | $2,880 | $269,000 | $130,500 | $138,500 |
Source: Public Records
Map
Nearby Homes
- 3724 Lockwood Rd
- 6322 Leaflet Ln
- 5575 E Whitmore Ave
- 1808 Apiary Way
- 6122 Honey Haven Ln
- 6101 Honey Haven Ln
- 6114 Honey Haven Ln
- 6138 Honey Haven Ln
- 6130 Honey Haven Ln
- 6150 Honey Haven Ln
- 6117 Honey Haven Ln
- 6154 Honey Haven Ln
- 6129 Honey Haven Ln
- 6204 Honey Haven Ln
- 6143 Honey Haven Ln
- 6208 Honey Haven Ln
- 6200 Honey Haven Ln
- 6212 Honey Haven Ln
- 6216 Honey Haven Ln
- 6213 Honey Haven Ln
- 5236 Roeding Rd
- 5308 Roeding Rd
- 5218 Roeding Rd
- 5324 Roeding Rd
- 5301 Roeding Rd
- 5149 Roeding Rd
- 5124 Roeding Rd
- 5348 Roeding Rd
- 5231 Roeding Rd
- 5372 Roeding Rd
- 5107 Roeding Rd
- 5042 Roeding Rd
- 5412 Roeding Rd
- 5043 Roeding Rd
- 3400 Washington Rd
- 3424 Washington Rd
- 3324 Washington Rd
- 5436 Roeding Rd
- 5419 Roeding Rd
- 3624 Washington Rd
Your Personal Tour Guide
Ask me questions while you tour the home.