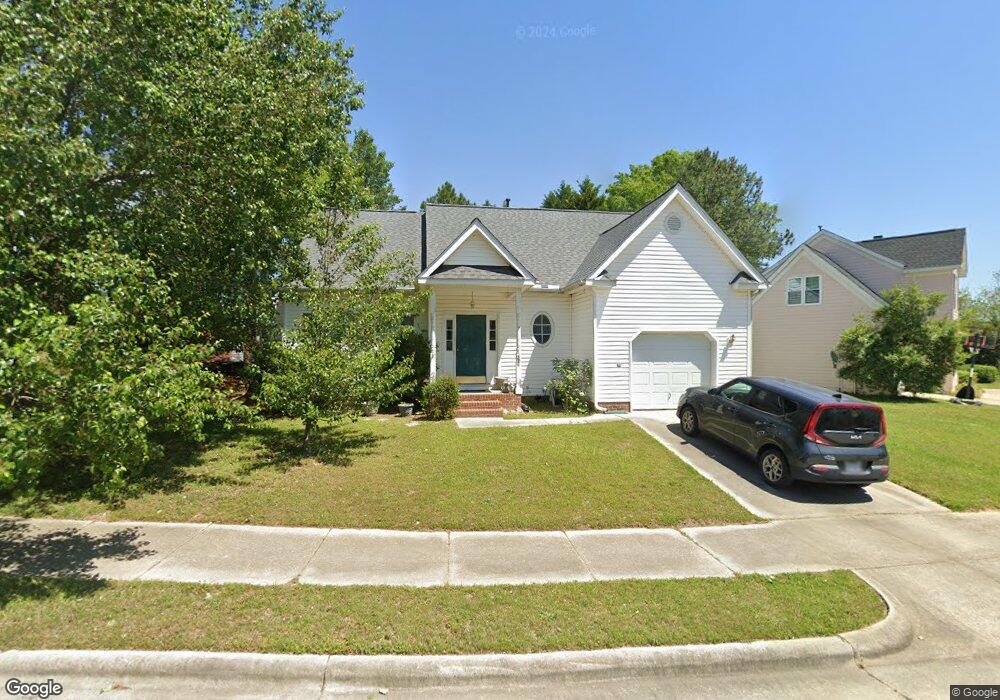
524 Hanska Way Raleigh, NC 27610
Southeast Raleigh NeighborhoodEstimated Value: $324,000 - $350,000
--
Bed
3
Baths
1,794
Sq Ft
$188/Sq Ft
Est. Value
About This Home
This home is located at 524 Hanska Way, Raleigh, NC 27610 and is currently estimated at $337,068, approximately $187 per square foot. 524 Hanska Way is a home located in Wake County with nearby schools including Rogers Lane Elementary, River Bend Middle, and Southeast Raleigh Magnet High School.
Ownership History
Date
Name
Owned For
Owner Type
Purchase Details
Closed on
Mar 21, 2019
Sold by
Hyatt Patricia Z and Hyatt Patricia S
Bought by
Cook Dale A and Joe C Hyatt Sole Benefit Trust
Current Estimated Value
Purchase Details
Closed on
Mar 29, 1999
Sold by
Olde South Homes Inc
Bought by
Hyatt Patricia Z
Home Financials for this Owner
Home Financials are based on the most recent Mortgage that was taken out on this home.
Original Mortgage
$53,000
Outstanding Balance
$13,175
Interest Rate
6.82%
Estimated Equity
$323,893
Purchase Details
Closed on
Aug 6, 1998
Sold by
Olde South Homes Inc
Bought by
Solaris Development Corp
Purchase Details
Closed on
Jun 19, 1998
Sold by
Solaris Development Corp
Bought by
Olde South Homes Inc
Purchase Details
Closed on
Mar 10, 1998
Sold by
Turf Grass Farm Develpment Company
Bought by
Solaris Development Corp and Sunstar Homes
Create a Home Valuation Report for This Property
The Home Valuation Report is an in-depth analysis detailing your home's value as well as a comparison with similar homes in the area
Home Values in the Area
Average Home Value in this Area
Purchase History
| Date | Buyer | Sale Price | Title Company |
|---|---|---|---|
| Cook Dale A | -- | None Available | |
| Hyatt Patricia Z | $133,000 | -- | |
| Solaris Development Corp | $17,000 | -- | |
| Olde South Homes Inc | $34,000 | -- | |
| Solaris Development Corp | $19,000 | -- |
Source: Public Records
Mortgage History
| Date | Status | Borrower | Loan Amount |
|---|---|---|---|
| Open | Hyatt Patricia Z | $53,000 |
Source: Public Records
Tax History Compared to Growth
Tax History
| Year | Tax Paid | Tax Assessment Tax Assessment Total Assessment is a certain percentage of the fair market value that is determined by local assessors to be the total taxable value of land and additions on the property. | Land | Improvement |
|---|---|---|---|---|
| 2025 | $2,961 | $337,176 | $80,000 | $257,176 |
| 2024 | $2,948 | $337,176 | $80,000 | $257,176 |
| 2023 | $2,394 | $217,805 | $35,000 | $182,805 |
| 2022 | $2,225 | $217,805 | $35,000 | $182,805 |
| 2021 | $2,139 | $217,805 | $35,000 | $182,805 |
| 2020 | $2,100 | $217,805 | $35,000 | $182,805 |
| 2019 | $928 | $160,070 | $25,000 | $135,070 |
| 2018 | $894 | $160,070 | $25,000 | $135,070 |
| 2017 | $853 | $160,070 | $25,000 | $135,070 |
| 2016 | $835 | $160,070 | $25,000 | $135,070 |
| 2015 | $888 | $167,558 | $26,000 | $141,558 |
| 2014 | $1,665 | $167,558 | $26,000 | $141,558 |
Source: Public Records
Map
Nearby Homes
- 413 Hanska Way
- 612 Hanska Way
- 5109 Heather Ridge Ln
- 5236 Turf Grass Ct
- 5505 Pennfine Dr
- 5512 Pennfine Dr
- 5204 Bentgrass Dr
- 821 White Daisies Ct
- 900 Reflection Ct
- 5308 Bentgrass Dr
- 5301 Peacenest Dr
- 5308 Seaspray Ln
- 501 Dandelion Ct
- 300 Gilman Ln Unit 101
- 331 Gilman Ln Unit 106
- 108 Penncross Dr
- 1012 Stormy Ln
- 320 Gilman Ln Unit 106
- 320 Gilman Ln Unit 110
- 801 Falling Wind Ct
- 532 Hanska Way
- 508 Hanska Way
- 429 Mountain Lake Dr
- 425 Mountain Lake Dr
- 536 Hanska Way
- 504 Hanska Way
- 529 Hanska Way
- 525 Hanska Way
- 509 Hanska Way
- 533 Hanska Way
- 513 Hanska Way
- 433 Mountain Lake Dr
- 500 Hanska Way
- 540 Hanska Way
- 505 Hanska Way
- 421 Mountain Lake Dr
- 521 Hanska Way
- 537 Hanska Way
- 517 Hanska Way
- 517 Hanska Way Unit 246