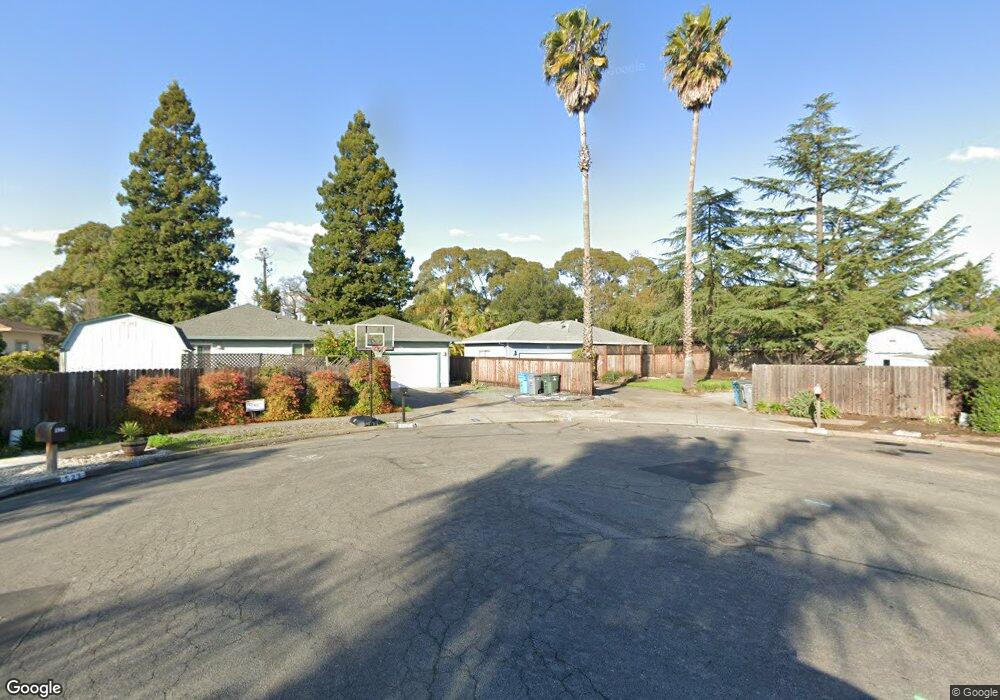
524 Squirrel Ct Santa Rosa, CA 95401
Copperfield NeighborhoodEstimated Value: $635,000 - $712,355
3
Beds
2
Baths
1,216
Sq Ft
$555/Sq Ft
Est. Value
About This Home
This home is located at 524 Squirrel Ct, Santa Rosa, CA 95401 and is currently estimated at $674,839, approximately $554 per square foot. 524 Squirrel Ct is a home located in Sonoma County with nearby schools including Elsie Allen High School, Wright Charter, and Oak Grove Elementary/Willowside Middle School.
Ownership History
Date
Name
Owned For
Owner Type
Purchase Details
Closed on
Dec 7, 2021
Sold by
Orourke Kristopher and Lacey Danielle R
Bought by
Orourke Kristopher and Lacey Danielle R
Current Estimated Value
Home Financials for this Owner
Home Financials are based on the most recent Mortgage that was taken out on this home.
Original Mortgage
$343,500
Interest Rate
3.22%
Mortgage Type
New Conventional
Purchase Details
Closed on
Sep 15, 2014
Sold by
Reid Clifford C and Reid Marilyn R
Bought by
Rourke Kristopher O and Lacey Danielle R
Home Financials for this Owner
Home Financials are based on the most recent Mortgage that was taken out on this home.
Original Mortgage
$374,300
Interest Rate
4.09%
Mortgage Type
New Conventional
Purchase Details
Closed on
Dec 13, 1993
Sold by
Va
Bought by
Reid Clifford C and Reid Marilyn R
Home Financials for this Owner
Home Financials are based on the most recent Mortgage that was taken out on this home.
Original Mortgage
$135,200
Interest Rate
7.38%
Create a Home Valuation Report for This Property
The Home Valuation Report is an in-depth analysis detailing your home's value as well as a comparison with similar homes in the area
Home Values in the Area
Average Home Value in this Area
Purchase History
| Date | Buyer | Sale Price | Title Company |
|---|---|---|---|
| Orourke Kristopher | -- | First American Title | |
| Rourke Kristopher O | $394,000 | Fidelity National Title Co | |
| Reid Clifford C | -- | North Bay Title |
Source: Public Records
Mortgage History
| Date | Status | Borrower | Loan Amount |
|---|---|---|---|
| Previous Owner | Orourke Kristopher | $343,500 | |
| Previous Owner | Rourke Kristopher O | $374,300 | |
| Previous Owner | Reid Clifford C | $135,200 |
Source: Public Records
Tax History Compared to Growth
Tax History
| Year | Tax Paid | Tax Assessment Tax Assessment Total Assessment is a certain percentage of the fair market value that is determined by local assessors to be the total taxable value of land and additions on the property. | Land | Improvement |
|---|---|---|---|---|
| 2025 | $5,387 | $473,519 | $189,286 | $284,233 |
| 2024 | $5,387 | $464,235 | $185,575 | $278,660 |
| 2023 | $5,387 | $455,134 | $181,937 | $273,197 |
| 2022 | $5,085 | $446,211 | $178,370 | $267,841 |
| 2021 | $4,994 | $437,463 | $174,873 | $262,590 |
| 2020 | $4,975 | $432,978 | $173,080 | $259,898 |
| 2019 | $4,931 | $424,489 | $169,687 | $254,802 |
| 2018 | $4,894 | $416,166 | $166,360 | $249,806 |
| 2017 | $4,794 | $408,007 | $163,099 | $244,908 |
| 2016 | $4,753 | $400,007 | $159,901 | $240,106 |
| 2015 | $4,600 | $394,000 | $157,500 | $236,500 |
| 2014 | $3,026 | $262,642 | $105,054 | $157,588 |
Source: Public Records
Map
Nearby Homes
- 438 Rusty Dr
- 2353 Hood Ct
- 2400 Valley Dr W
- 2333 Pacheco Place
- 234 Arboleda Dr
- 91 Westgate Cir
- 167 Sequoia Cir
- 2344 Donahue Ave
- 213 Monarch Ct
- 337 Westmont Place
- 415 Occidental Cir
- 2291 Truckee Dr
- 2484 College Park Cir
- 2315 Cross Ave
- 2467 College Park Cir
- 28 Westgate Cir
- 2305 Cross Ave
- 66 Somerset Dr
- 226 Regency Ct
- 23 Westgate Cir
- 527 Squirrel Ct
- 525 Chipmunk Ct
- 520 Squirrel Ct
- 523 Squirrel Ct
- 529 Chipmunk Ct
- 521 Chipmunk Ct
- 516 Squirrel Ct
- 519 Squirrel Ct
- 528 Chipmunk Ct
- 520 Heavy Ct
- 517 Chipmunk Ct
- 515 Squirrel Ct
- 512 Squirrel Ct
- 516 Heavy Ct
- 524 Chipmunk Ct
- 513 Chipmunk Ct
- 524 Heavy Ct
- 520 Chipmunk Ct
- 511 Squirrel Ct
- 516 Chipmunk Ct