5241 E 2nd St Long Beach, CA 90803
Belmont Shore NeighborhoodAbout This Home
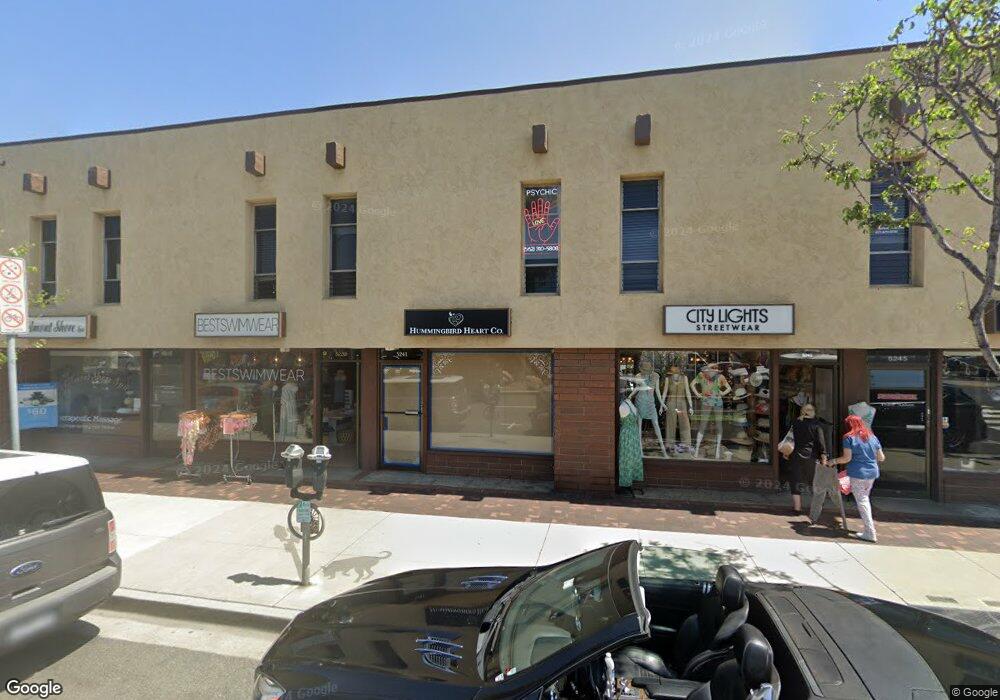
This home is located at 5241 E 2nd St, Long Beach, CA 90803. 5241 E 2nd St is a home located in Los Angeles County with nearby schools including Lowell Elementary School, Rogers Middle School, and Woodrow Wilson High School.
Ownership History
We collect this data history from publicly available records. To have your information removed, we recommend requesting removal directly through your county’s website.
Purchase Details
Purchase Details
Purchase Details
Home Financials for this Owner
Home Financials are based on the most recent Mortgage that was taken out on this home.Purchase Details
Home Financials for this Owner
Home Financials are based on the most recent Mortgage that was taken out on this home.Purchase Details
Purchase Details
Home Values in the Area
Average Home Value in this Area
Purchase History
We collect this data history from publicly available records. To have your information removed, we recommend requesting removal directly through your county’s website.
| Date | Buyer | Sale Price | Title Company |
|---|---|---|---|
| -- | None Listed On Document | ||
| -- | None Available | ||
| $4,200,000 | North American Title Company | ||
| -- | Stewart Title Riverside | ||
| -- | -- | ||
| -- | -- |
Mortgage History
We collect this data history from publicly available records. To have your information removed, we recommend requesting removal directly through your county’s website.
| Date | Status | Borrower | Loan Amount |
|---|---|---|---|
| Previous Owner | $2,100,000 | ||
| Previous Owner | $1,400,000 |
Tax History
We collect this data history from publicly available records. To have your information removed, we recommend requesting removal directly through your county’s website.
| Year | Tax Paid | Tax Assessment Tax Assessment Total Assessment is a certain percentage of the fair market value that is determined by local assessors to be the total taxable value of land and additions on the property. | Land | Improvement |
|---|---|---|---|---|
| 2025 | $61,626 | $4,609,669 | $2,645,628 | $1,964,041 |
| 2024 | $58,976 | $4,519,284 | $2,593,753 | $1,925,531 |
| 2023 | $58,031 | $4,430,672 | $2,542,896 | $1,887,776 |
| 2022 | $56,641 | $4,343,797 | $2,493,036 | $1,850,761 |
| 2021 | $53,467 | $4,258,625 | $2,444,153 | $1,814,472 |
| 2020 | $53,328 | $4,214,959 | $2,419,092 | $1,795,867 |
| 2019 | $53,020 | $4,132,313 | $2,371,659 | $1,760,654 |
| 2018 | $51,798 | $4,051,288 | $2,325,156 | $1,726,132 |
| 2016 | $47,446 | $3,893,973 | $2,234,868 | $1,659,105 |
| 2015 | $45,557 | $3,835,483 | $2,201,299 | $1,634,184 |
| 2014 | $45,198 | $3,760,352 | $2,158,179 | $1,602,173 |
Map
- 224 Covina Ave
- 210 Glendora Ave
- 179 Pomona Ave
- 205 Argonne Ave
- 153 Granada Ave
- 143 Pomona Ave
- 2772 2A E 2nd St Unit A2
- 170 Saint Joseph Ave
- 158 Santa Ana Ave
- 201 Bay Shore Ave Unit 101
- 143 Claremont Ave
- 5120 E Livingston Dr
- 170 Park Ave
- 69 Glendora Ave
- 112 Santa Ana Ave
- 74 Argonne Ave
- 104 Saint Joseph Ave
- 265 Bay Shore Ave
- 258 Argonne Ave
- 5400 E The Toledo Unit 701
- 5229 E 2nd St
- 204 Corona Ave
- 206 Corona Ave
- 209 Covina Ave
- 204 Covina Ave
- 208 Corona Ave
- 206 Covina Ave
- 211 Covina Ave
- 208 Covina Ave
- 210 Corona Ave
- 5246 E 2nd St
- 213 Covina Ave Unit 2
- 213 Covina Ave Unit 1
- 213 Covina Ave Unit 4
- 213 Covina Ave
- 210 Covina Ave
- 212 Corona Ave
- 5216 E 2nd St
- 205 Corona Ave
- 205 La Verne Ave
Ask me questions while you tour the home.