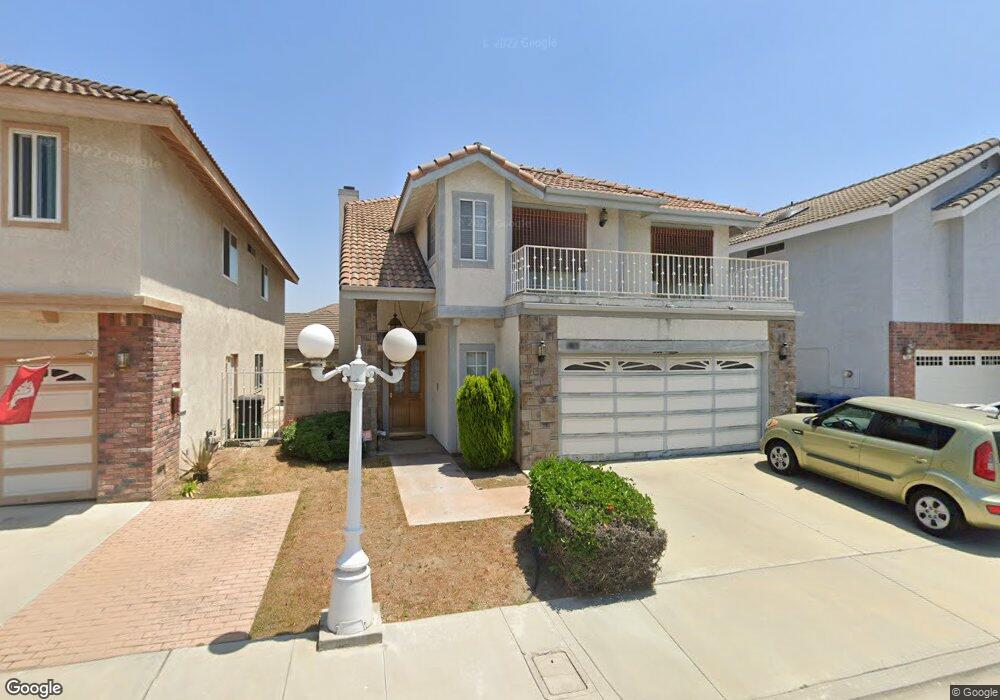
5246 Sereno Dr Temple City, CA 91780
Estimated Value: $1,193,000 - $1,600,522
4
Beds
3
Baths
2,351
Sq Ft
$591/Sq Ft
Est. Value
About This Home
This home is located at 5246 Sereno Dr, Temple City, CA 91780 and is currently estimated at $1,389,631, approximately $591 per square foot. 5246 Sereno Dr is a home located in Los Angeles County with nearby schools including La Rosa Elementary, Oak Avenue Intermediate School, and Temple City High School.
Ownership History
Date
Name
Owned For
Owner Type
Purchase Details
Closed on
Dec 9, 2022
Sold by
Shih Jessie Chuni
Bought by
Jessie Chuni Shih Family Trust
Current Estimated Value
Purchase Details
Closed on
Oct 23, 2002
Sold by
Chuck Stephen and Chuck Penny
Bought by
Shih Jessie
Purchase Details
Closed on
Feb 2, 1996
Sold by
Kei Eun Sook
Bought by
Chuck Stephen and Chuck Penny
Home Financials for this Owner
Home Financials are based on the most recent Mortgage that was taken out on this home.
Original Mortgage
$203,000
Interest Rate
7.1%
Purchase Details
Closed on
Jan 19, 1995
Sold by
Nikoui Kareem A and Nikoui Mercedes A
Bought by
Kei Yong Sam and Kei Eun Sook
Home Financials for this Owner
Home Financials are based on the most recent Mortgage that was taken out on this home.
Original Mortgage
$182,000
Interest Rate
9.28%
Create a Home Valuation Report for This Property
The Home Valuation Report is an in-depth analysis detailing your home's value as well as a comparison with similar homes in the area
Home Values in the Area
Average Home Value in this Area
Purchase History
| Date | Buyer | Sale Price | Title Company |
|---|---|---|---|
| Jessie Chuni Shih Family Trust | -- | -- | |
| Shih Jessie | $377,000 | Southland Title Corporation | |
| Chuck Stephen | $265,000 | Old Republic Title Company | |
| Kei Yong Sam | $282,000 | Continental Lawyers Title Co |
Source: Public Records
Mortgage History
| Date | Status | Borrower | Loan Amount |
|---|---|---|---|
| Previous Owner | Chuck Stephen | $203,000 | |
| Previous Owner | Kei Yong Sam | $182,000 | |
| Closed | Shih Jessie | $0 |
Source: Public Records
Tax History Compared to Growth
Tax History
| Year | Tax Paid | Tax Assessment Tax Assessment Total Assessment is a certain percentage of the fair market value that is determined by local assessors to be the total taxable value of land and additions on the property. | Land | Improvement |
|---|---|---|---|---|
| 2025 | $6,584 | $545,999 | $285,598 | $260,401 |
| 2024 | $6,584 | $535,295 | $279,999 | $255,296 |
| 2023 | $6,436 | $524,800 | $274,509 | $250,291 |
| 2022 | $6,030 | $514,511 | $269,127 | $245,384 |
| 2021 | $6,127 | $504,423 | $263,850 | $240,573 |
| 2019 | $5,909 | $489,464 | $256,025 | $233,439 |
| 2018 | $5,718 | $479,867 | $251,005 | $228,862 |
| 2016 | $5,464 | $461,235 | $241,259 | $219,976 |
| 2015 | $5,372 | $454,308 | $237,636 | $216,672 |
| 2014 | $5,294 | $445,410 | $232,982 | $212,428 |
Source: Public Records
Map
Nearby Homes
- 5241 Rosemead Blvd Unit B
- 5463 Sultana Ave
- 9134 Rancho Real Rd
- 5143 Acacia St
- 9224 Pentland St
- 5619 Sultana Ave Unit A
- 4917 Encinita Ave
- 9063 Evansport Dr
- 9409 Olive St
- 8739 E Sienna Ln
- 5635 Noel Dr
- 5327 Buttons Ave
- 1281 E Broadway
- 5530 Alessandro Ave
- 9406 La Rosa Dr
- 0 Sultana Ave
- 5823 Myda Ave
- 4850 Heleo Ave
- Plan 2 at Cassia
- Plan 4 at Cassia
- 5242 Sereno Dr
- 5248 Sereno Dr
- 5252 Sereno Dr Unit 6
- 5256 Sereno Dr Unit 5
- 5258 Sereno Dr Unit 4
- 5260 Sereno Dr Unit 3
- 5262 Sereno Dr Unit 2
- 5266 Sereno Dr
- 5250 Sereno Dr Unit 7
- 5238 Sereno Dr Unit 1
- 5240 Sereno Dr Unit 2
- 5232 Sereno Dr Unit D
- 5232 Sereno Dr Unit C
- 5232 Sereno Dr Unit B
- 5232 Sereno Dr Unit A
- 5335 Sultana Ave
- 5233 Sereno Dr
- 5233 Sereno Dr
- 5330 Sultana Ave
- 5334 Sultana Ave