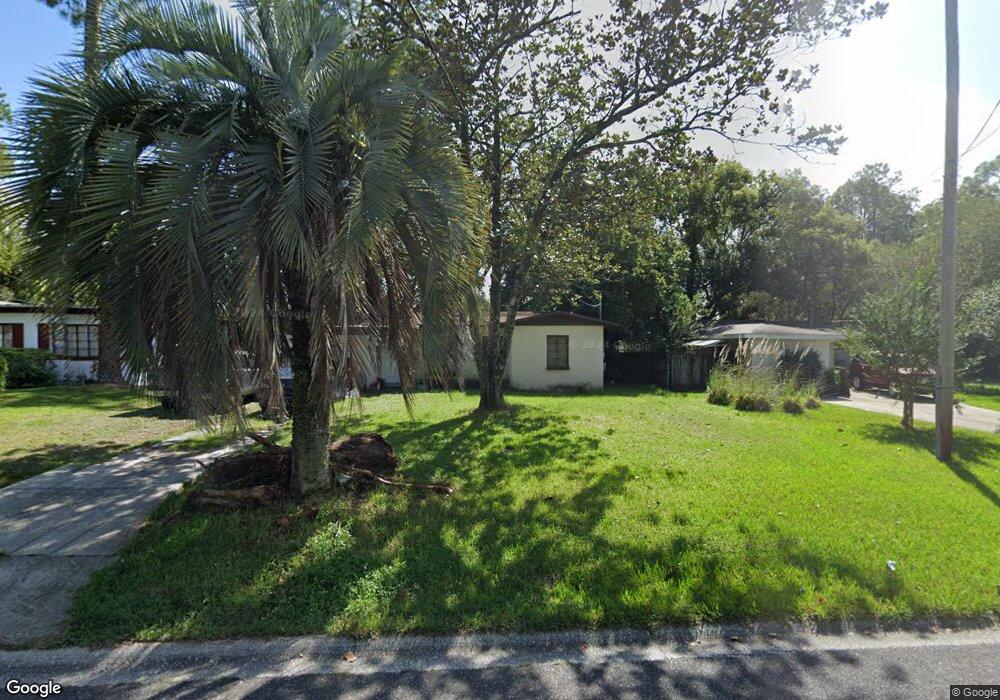
5248 Marlene Ave Jacksonville, FL 32210
Lakeshore NeighborhoodEstimated Value: $120,000 - $162,828
3
Beds
1
Bath
840
Sq Ft
$168/Sq Ft
Est. Value
About This Home
This home is located at 5248 Marlene Ave, Jacksonville, FL 32210 and is currently estimated at $140,957, approximately $167 per square foot. 5248 Marlene Ave is a home located in Duval County with nearby schools including Andros Karperos, Hyde Park Elementary School, and Lake Shore Middle School.
Ownership History
Date
Name
Owned For
Owner Type
Purchase Details
Closed on
Jul 30, 2025
Sold by
New Old House Llc
Bought by
New Old House Llc and Chacon
Current Estimated Value
Purchase Details
Closed on
Dec 11, 2024
Sold by
Synergy Redevelopers Llc
Bought by
New Old House Llc
Home Financials for this Owner
Home Financials are based on the most recent Mortgage that was taken out on this home.
Original Mortgage
$180,100
Interest Rate
6.78%
Mortgage Type
New Conventional
Purchase Details
Closed on
Jan 1, 2016
Bought by
Miccio Jillian
Purchase Details
Closed on
May 27, 2010
Sold by
Miccio Michael L
Bought by
Miccio Michael L and Michael L Miccio Revocable Trust
Purchase Details
Closed on
May 12, 2006
Sold by
Grisham Patrick and Grisham Jessica
Bought by
Miccio Michael
Purchase Details
Closed on
May 18, 2005
Sold by
Strother Craig
Bought by
Grisham Patrick and Grisham Jessica
Create a Home Valuation Report for This Property
The Home Valuation Report is an in-depth analysis detailing your home's value as well as a comparison with similar homes in the area
Home Values in the Area
Average Home Value in this Area
Purchase History
| Date | Buyer | Sale Price | Title Company |
|---|---|---|---|
| New Old House Llc | $100 | None Listed On Document | |
| New Old House Llc | $100 | None Listed On Document | |
| New Old House Llc | $123,000 | Landmark Title | |
| New Old House Llc | $123,000 | Landmark Title | |
| Synergy Redevelopers Llc | $95,000 | Landmark Title | |
| Miccio Jillian | $100 | -- | |
| Miccio Michael L | -- | Attorney | |
| Miccio Michael | -- | None Available | |
| Grisham Patrick | $85,000 | Stc |
Source: Public Records
Mortgage History
| Date | Status | Borrower | Loan Amount |
|---|---|---|---|
| Previous Owner | New Old House Llc | $180,100 |
Source: Public Records
Tax History Compared to Growth
Tax History
| Year | Tax Paid | Tax Assessment Tax Assessment Total Assessment is a certain percentage of the fair market value that is determined by local assessors to be the total taxable value of land and additions on the property. | Land | Improvement |
|---|---|---|---|---|
| 2025 | $2,211 | $125,904 | $41,405 | $84,499 |
| 2024 | $2,114 | $126,119 | $41,405 | $84,714 |
| 2023 | $2,114 | $126,572 | $41,405 | $85,167 |
| 2022 | $1,762 | $102,397 | $31,850 | $70,547 |
| 2021 | $1,635 | $88,807 | $31,850 | $56,957 |
| 2020 | $1,472 | $74,066 | $20,702 | $53,364 |
| 2019 | $1,413 | $73,897 | $20,702 | $53,195 |
| 2018 | $1,305 | $66,169 | $14,332 | $51,837 |
| 2017 | $1,180 | $54,766 | $12,740 | $42,026 |
| 2016 | $1,097 | $50,311 | $0 | $0 |
| 2015 | $1,019 | $44,312 | $0 | $0 |
| 2014 | $1,015 | $43,608 | $0 | $0 |
Source: Public Records
Map
Nearby Homes
- 1850 Harvester St
- 5331 Shirley Ave
- 5358 Camille Ave
- 5133 Palmer Ave
- 5110 Janice Cir E
- 5050 San Juan Ave
- 5037 Camille Ave Unit 3
- 5315 Colonial Ave
- 5106 Appleton Ave
- 5316 Colonial Ave
- 5615 San Juan Ave Unit 112
- 5615 San Juan Ave Unit 310
- 5615 San Juan Ave Unit 308
- 5615 San Juan Ave Unit 105
- 5615 San Juan Ave Unit 411
- 5615 San Juan Ave Unit 608
- 5332 Colonial Ave
- 5044 Colonial Ave
- 5026 Colonial Ave
- 4839 Appleton Ave
- 5242 Marlene Ave
- 1877 Retaw St
- 5247 Shirley Ave
- 5236 Marlene Ave
- 5241 Shirley Ave
- 5253 Shirley Ave
- 5235 Shirley Ave
- 5255 Marlene Ave
- 5230 Marlene Ave
- 5249 Marlene Ave
- 5241 Marlene Ave
- 5227 Shirley Ave
- 5235 Marlene Ave
- 5263 Marlene Ave
- 5222 Marlene Ave
- 5229 Marlene Ave
- 5221 Shirley Ave
- 5303 Marlene Ave
- 5248 Shirley Ave
- 5254 Shirley Ave