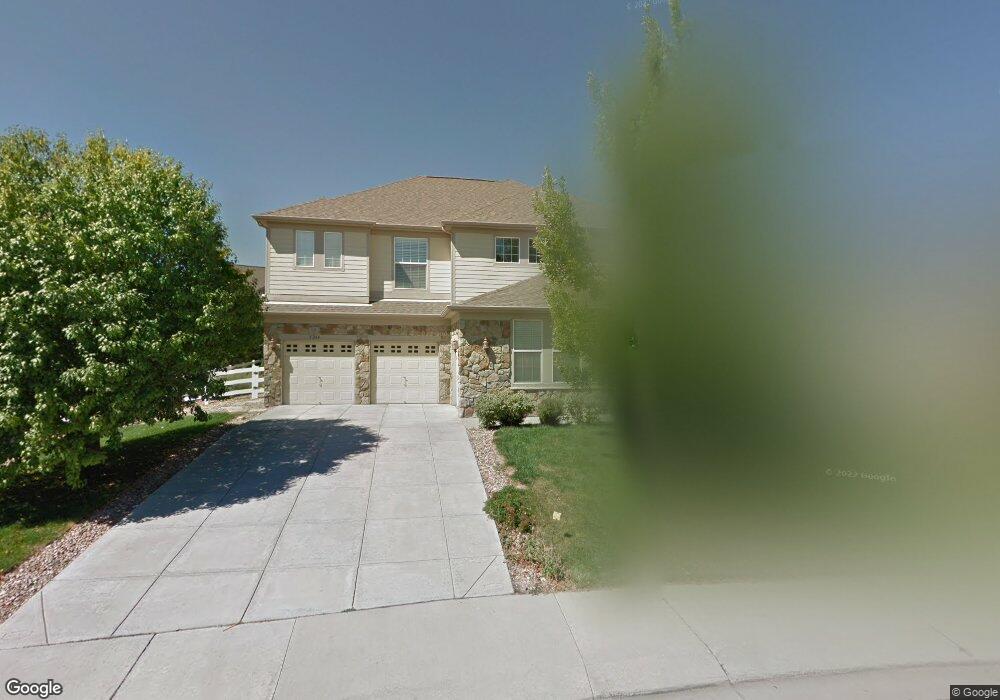
5249 Bella Vista Dr Longmont, CO 80503
Upper Clover Basin NeighborhoodEstimated Value: $903,000 - $985,000
4
Beds
4
Baths
3,019
Sq Ft
$308/Sq Ft
Est. Value
About This Home
This home is located at 5249 Bella Vista Dr, Longmont, CO 80503 and is currently estimated at $931,273, approximately $308 per square foot. 5249 Bella Vista Dr is a home located in Boulder County with nearby schools including Eagle Crest Elementary School, Altona Middle School, and Silver Creek High School.
Ownership History
Date
Name
Owned For
Owner Type
Purchase Details
Closed on
Sep 13, 2011
Sold by
Jones David C and Kelly Heather Ann
Bought by
Jones David C
Current Estimated Value
Purchase Details
Closed on
Oct 15, 2002
Sold by
Jones David C
Bought by
Jones David C
Home Financials for this Owner
Home Financials are based on the most recent Mortgage that was taken out on this home.
Original Mortgage
$64,000
Outstanding Balance
$26,694
Interest Rate
6.09%
Mortgage Type
Credit Line Revolving
Estimated Equity
$904,579
Purchase Details
Closed on
Sep 12, 2002
Sold by
Pulte Home Corp
Bought by
Jones David C
Home Financials for this Owner
Home Financials are based on the most recent Mortgage that was taken out on this home.
Original Mortgage
$64,000
Outstanding Balance
$26,694
Interest Rate
6.09%
Mortgage Type
Credit Line Revolving
Estimated Equity
$904,579
Create a Home Valuation Report for This Property
The Home Valuation Report is an in-depth analysis detailing your home's value as well as a comparison with similar homes in the area
Home Values in the Area
Average Home Value in this Area
Purchase History
| Date | Buyer | Sale Price | Title Company |
|---|---|---|---|
| Jones David C | -- | None Available | |
| Jones David C | -- | -- | |
| Jones David C | $405,311 | Land Title |
Source: Public Records
Mortgage History
| Date | Status | Borrower | Loan Amount |
|---|---|---|---|
| Open | Jones David C | $64,000 | |
| Open | Jones David C | $300,700 |
Source: Public Records
Tax History Compared to Growth
Tax History
| Year | Tax Paid | Tax Assessment Tax Assessment Total Assessment is a certain percentage of the fair market value that is determined by local assessors to be the total taxable value of land and additions on the property. | Land | Improvement |
|---|---|---|---|---|
| 2025 | $5,781 | $60,713 | $13,263 | $47,450 |
| 2024 | $5,781 | $60,713 | $13,263 | $47,450 |
| 2023 | $5,702 | $60,434 | $14,097 | $50,022 |
| 2022 | $4,859 | $49,102 | $10,668 | $38,434 |
| 2021 | $4,922 | $50,515 | $10,975 | $39,540 |
| 2020 | $4,572 | $47,068 | $10,439 | $36,629 |
| 2019 | $4,500 | $47,068 | $10,439 | $36,629 |
| 2018 | $3,980 | $41,897 | $9,144 | $32,753 |
| 2017 | $3,926 | $46,319 | $10,109 | $36,210 |
| 2016 | $3,766 | $39,402 | $12,258 | $27,144 |
| 2015 | $3,589 | $32,716 | $7,562 | $25,154 |
| 2014 | $3,056 | $32,716 | $7,562 | $25,154 |
Source: Public Records
Map
Nearby Homes
- 4240 Riley Dr
- 4532 Heatherhill Ct
- 4522 Portofino Dr
- 1601 Venice Ln
- 1923 High Plains Dr
- 1580 Venice Ln
- 1663 Venice Ln
- 5120 Heatherhill St
- 5025 Eagan Cir
- 2286 Star Hill St
- 4759 Summerlin Place
- 8584 Summerlin Place
- 2316 Star Hill St
- 1513 Cannon Mountain Dr
- 906 Cranberry Ct
- 8712 Portico Ln
- 913 Ninebark Ln
- 1906 Wildrose Dr
- 841 Robert St
- 3617 Sunflower Cir
- 5253 Bella Vista Dr
- 5245 Bella Vista Dr
- 1712 Roma Ct
- 1716 Roma Ct
- 1704 Roma Ct
- 4411 Palermo Place
- 1720 Roma Ct
- 5244 Bella Vista Dr
- 1702 Naples Ln
- 1632 Naples Ln
- 1628 Naples Ln
- 1724 Roma Ct
- 1710 Naples Ln
- 5240 Bella Vista Dr
- 1707 Roma Ct
- 1624 Naples Ln
- 1711 Roma Ct
- 1703 Roma Ct
- 1714 Naples Ln
- 1715 Roma Ct