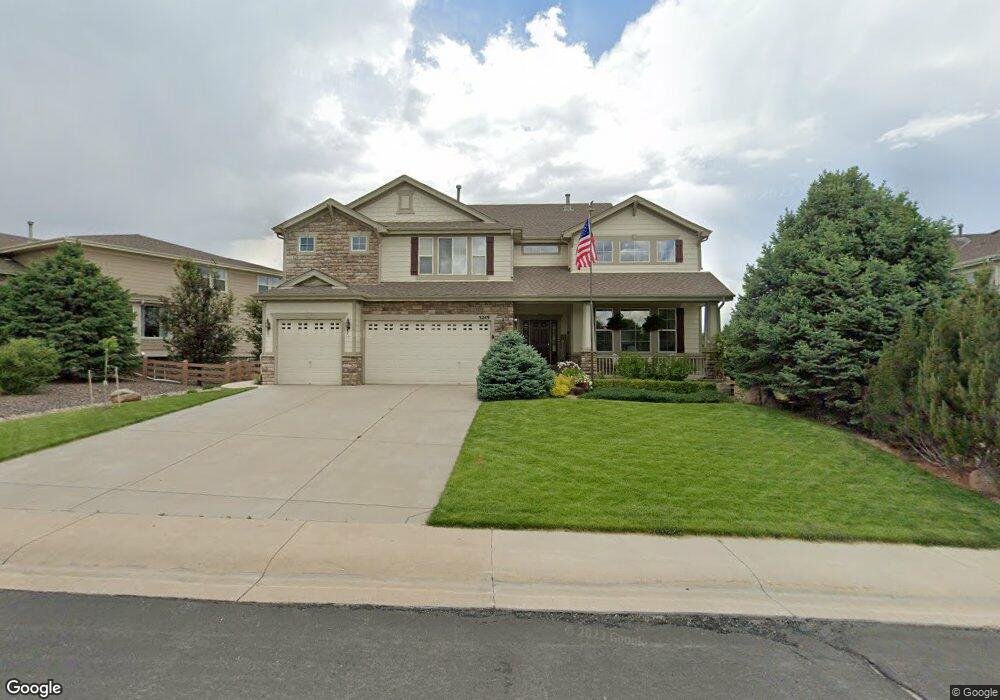
5249 Mining Camp Trail Parker, CO 80134
The Pinery NeighborhoodEstimated Value: $1,012,038 - $1,126,000
4
Beds
5
Baths
6,455
Sq Ft
$163/Sq Ft
Est. Value
About This Home
This home is located at 5249 Mining Camp Trail, Parker, CO 80134 and is currently estimated at $1,054,760, approximately $163 per square foot. 5249 Mining Camp Trail is a home located in Douglas County with nearby schools including Mountain View Elementary School, Northeast Elementary School, and Sagewood Middle School.
Ownership History
Date
Name
Owned For
Owner Type
Purchase Details
Closed on
Jun 23, 2011
Sold by
M & T Bank
Bought by
Specht Keith A and Specht Janet K
Current Estimated Value
Home Financials for this Owner
Home Financials are based on the most recent Mortgage that was taken out on this home.
Original Mortgage
$300,000
Outstanding Balance
$207,105
Interest Rate
4.66%
Mortgage Type
New Conventional
Estimated Equity
$847,655
Purchase Details
Closed on
Apr 1, 2011
Sold by
Almquist Catherine M and Almquist Randall E
Bought by
M & T Bank
Purchase Details
Closed on
Oct 13, 2004
Sold by
Kdb Homes Inc
Bought by
Almquist Randall E and Almquist Catherine M
Home Financials for this Owner
Home Financials are based on the most recent Mortgage that was taken out on this home.
Original Mortgage
$473,100
Interest Rate
5.95%
Mortgage Type
Unknown
Create a Home Valuation Report for This Property
The Home Valuation Report is an in-depth analysis detailing your home's value as well as a comparison with similar homes in the area
Home Values in the Area
Average Home Value in this Area
Purchase History
| Date | Buyer | Sale Price | Title Company |
|---|---|---|---|
| Specht Keith A | $450,000 | Fidelity National Title Insu | |
| M & T Bank | -- | None Available | |
| Almquist Randall E | $591,487 | Fahtco |
Source: Public Records
Mortgage History
| Date | Status | Borrower | Loan Amount |
|---|---|---|---|
| Open | Specht Keith A | $300,000 | |
| Previous Owner | Almquist Randall E | $473,100 | |
| Closed | Almquist Randall E | $118,275 |
Source: Public Records
Tax History Compared to Growth
Tax History
| Year | Tax Paid | Tax Assessment Tax Assessment Total Assessment is a certain percentage of the fair market value that is determined by local assessors to be the total taxable value of land and additions on the property. | Land | Improvement |
|---|---|---|---|---|
| 2024 | $7,628 | $72,360 | $11,980 | $60,380 |
| 2023 | $7,809 | $72,360 | $11,980 | $60,380 |
| 2022 | $7,305 | $52,850 | $7,890 | $44,960 |
| 2021 | $7,357 | $52,850 | $7,890 | $44,960 |
| 2020 | $6,480 | $47,720 | $9,120 | $38,600 |
| 2019 | $6,499 | $47,720 | $9,120 | $38,600 |
| 2018 | $6,178 | $44,920 | $8,290 | $36,630 |
| 2017 | $5,898 | $44,920 | $8,290 | $36,630 |
| 2016 | $6,133 | $45,220 | $6,870 | $38,350 |
| 2015 | $6,443 | $45,220 | $6,870 | $38,350 |
| 2014 | $5,729 | $38,590 | $5,030 | $33,560 |
Source: Public Records
Map
Nearby Homes
- 6017 Merchant Place
- 5349 Rustler Trail
- 6078 Bridle Path Ln
- 5453 Military Trail
- 5736 Cadara Way
- 5672 Vistancia Ct
- 6490 Coldwater Dr
- 6228 Dapplegray St
- 5625 Twilight Way
- 5657 Pinto Valley St
- 6083 Saddle Bow Ave
- 5334 Sedona Dr
- 6340 Verve Ln
- 6327 Verve Ln
- Wegner Plan at Toll Brothers at Cherry Creek Trail
- Breuer Plan at Toll Brothers at Cherry Creek Trail
- Jacobsen Plan at Toll Brothers at Cherry Creek Trail
- Ponti Plan at Toll Brothers at Cherry Creek Trail
- 6353 Verve Ln
- 6367 Verve Ln
- 5233 Mining Camp Trail
- 5261 Mining Camp Trail
- 5217 Mining Camp Trail
- 5273 Mining Camp Trail
- 5248 Mining Camp Trail
- 5274 Mining Camp Trail
- 5236 Mining Camp Trail
- 5201 Mining Camp Trail
- 5285 Mining Camp Trail
- 5208 Denim Ct
- 5226 Mining Camp Trail
- 5185 Mining Camp Trail
- 5304 Mining Camp Trail
- 5241 Streambed Trail
- 5200 Denim Ct
- 5297 Mining Camp Trail
- 5219 Streambed Trail
- 5194 Denim Ct
- 5976 Longhorn Place
- 5203 Streambed Trail