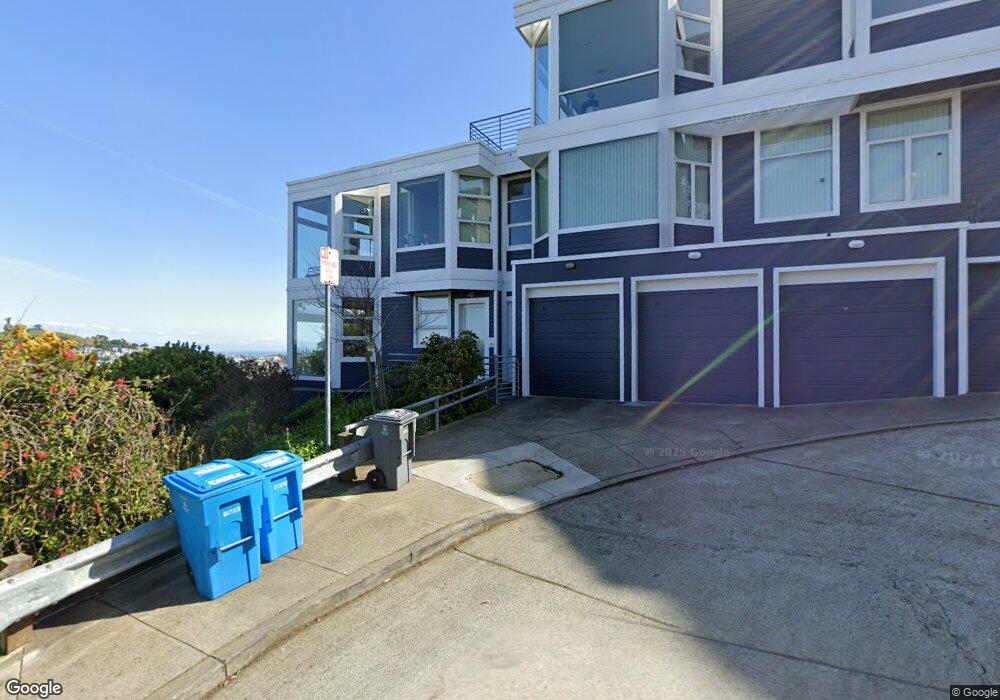
525 27th St Unit 1 San Francisco, CA 94131
Noe Valley NeighborhoodEstimated Value: $1,794,000 - $2,306,000
3
Beds
2
Baths
1,824
Sq Ft
$1,109/Sq Ft
Est. Value
About This Home
This home is located at 525 27th St Unit 1, San Francisco, CA 94131 and is currently estimated at $2,022,068, approximately $1,108 per square foot. 525 27th St Unit 1 is a home located in San Francisco County with nearby schools including Alvarado Elementary, James Lick Middle School, and St. Philip School.
Ownership History
Date
Name
Owned For
Owner Type
Purchase Details
Closed on
Mar 4, 2005
Sold by
Levine Lester and Bolle Elaine D
Bought by
Henderson Kathleen
Current Estimated Value
Purchase Details
Closed on
Aug 22, 2003
Sold by
Bolle Elaine D
Bought by
Levine Lester J and Bolle Elaine D
Home Financials for this Owner
Home Financials are based on the most recent Mortgage that was taken out on this home.
Original Mortgage
$730,000
Interest Rate
3.87%
Mortgage Type
New Conventional
Purchase Details
Closed on
May 25, 2001
Sold by
Rogers Howard K and Rogers Nancy Scott
Bought by
Bolle Elaine D
Home Financials for this Owner
Home Financials are based on the most recent Mortgage that was taken out on this home.
Original Mortgage
$740,000
Interest Rate
6.62%
Purchase Details
Closed on
Jan 7, 1998
Sold by
525 27Th Street Llc
Bought by
Rogers Howard K and Rogers Nancy Scott
Home Financials for this Owner
Home Financials are based on the most recent Mortgage that was taken out on this home.
Original Mortgage
$501,600
Interest Rate
7.75%
Create a Home Valuation Report for This Property
The Home Valuation Report is an in-depth analysis detailing your home's value as well as a comparison with similar homes in the area
Home Values in the Area
Average Home Value in this Area
Purchase History
| Date | Buyer | Sale Price | Title Company |
|---|---|---|---|
| Henderson Kathleen | $1,285,000 | Fidelity National Title Co | |
| Levine Lester J | -- | Fidelity National Title Co | |
| Bolle Elaine D | $925,000 | Fidelity National Title Co | |
| Rogers Howard K | $627,000 | Old Republic Title Company |
Source: Public Records
Mortgage History
| Date | Status | Borrower | Loan Amount |
|---|---|---|---|
| Previous Owner | Levine Lester J | $730,000 | |
| Previous Owner | Bolle Elaine D | $740,000 | |
| Previous Owner | Rogers Howard K | $501,600 |
Source: Public Records
Tax History Compared to Growth
Tax History
| Year | Tax Paid | Tax Assessment Tax Assessment Total Assessment is a certain percentage of the fair market value that is determined by local assessors to be the total taxable value of land and additions on the property. | Land | Improvement |
|---|---|---|---|---|
| 2025 | $20,600 | $1,791,164 | $895,582 | $895,582 |
| 2024 | $20,600 | $1,756,044 | $878,022 | $878,022 |
| 2023 | $20,304 | $1,721,612 | $860,806 | $860,806 |
| 2022 | $19,941 | $1,687,856 | $843,928 | $843,928 |
| 2021 | $19,596 | $1,654,762 | $827,381 | $827,381 |
| 2020 | $19,655 | $1,637,796 | $818,898 | $818,898 |
| 2019 | $18,977 | $1,605,684 | $802,842 | $802,842 |
| 2018 | $18,338 | $1,574,200 | $787,100 | $787,100 |
| 2017 | $18,121 | $1,543,334 | $771,667 | $771,667 |
| 2016 | $17,839 | $1,513,074 | $756,537 | $756,537 |
| 2015 | $17,621 | $1,490,348 | $745,174 | $745,174 |
| 2014 | $15,615 | $1,330,000 | $798,000 | $532,000 |
Source: Public Records
Map
Nearby Homes