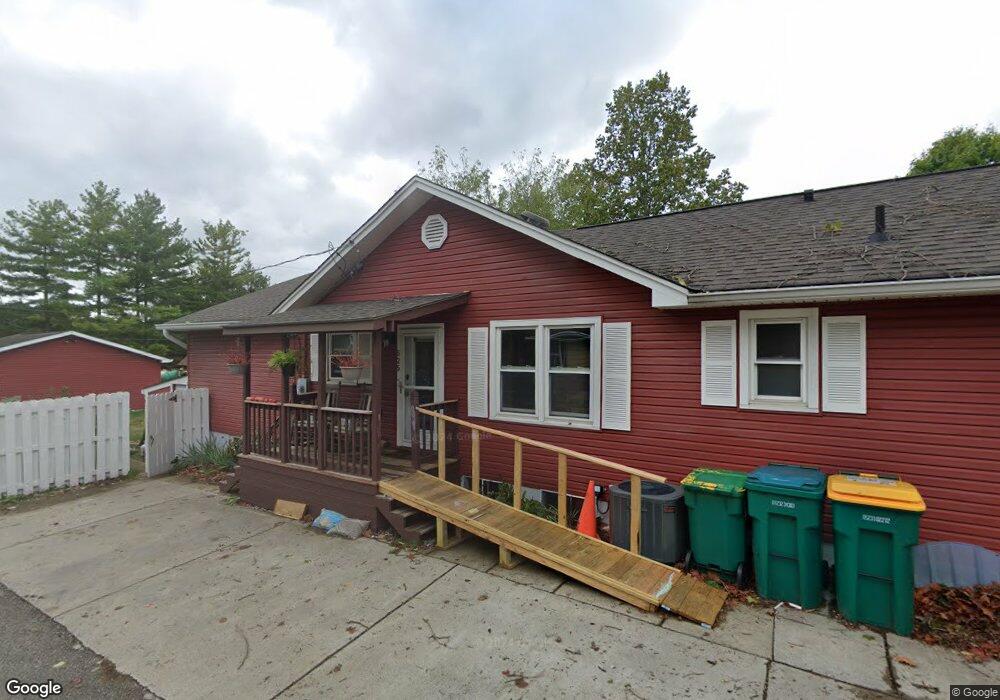
525 E Main St Plainfield, IN 46168
Estimated Value: $252,000 - $272,000
3
Beds
3
Baths
1,648
Sq Ft
$159/Sq Ft
Est. Value
About This Home
This home is located at 525 E Main St, Plainfield, IN 46168 and is currently estimated at $262,082, approximately $159 per square foot. 525 E Main St is a home located in Hendricks County with nearby schools including Van Buren Elementary School, Plainfield Community Middle School, and Plainfield High School.
Ownership History
Date
Name
Owned For
Owner Type
Purchase Details
Closed on
Aug 31, 2023
Sold by
Flood Scott J
Bought by
Flood John Scott and Flood Nicole M
Current Estimated Value
Home Financials for this Owner
Home Financials are based on the most recent Mortgage that was taken out on this home.
Original Mortgage
$309,900
Outstanding Balance
$301,613
Interest Rate
6.81%
Mortgage Type
New Conventional
Estimated Equity
-$39,531
Purchase Details
Closed on
Oct 16, 2017
Sold by
Flood Andrea J
Bought by
Flood Scott J
Home Financials for this Owner
Home Financials are based on the most recent Mortgage that was taken out on this home.
Original Mortgage
$133,900
Interest Rate
3.83%
Mortgage Type
New Conventional
Create a Home Valuation Report for This Property
The Home Valuation Report is an in-depth analysis detailing your home's value as well as a comparison with similar homes in the area
Home Values in the Area
Average Home Value in this Area
Purchase History
| Date | Buyer | Sale Price | Title Company |
|---|---|---|---|
| Flood John Scott | $300,000 | None Listed On Document | |
| Flood Scott J | -- | -- |
Source: Public Records
Mortgage History
| Date | Status | Borrower | Loan Amount |
|---|---|---|---|
| Open | Flood John Scott | $309,900 | |
| Previous Owner | Flood Scott J | $133,900 |
Source: Public Records
Tax History
| Year | Tax Paid | Tax Assessment Tax Assessment Total Assessment is a certain percentage of the fair market value that is determined by local assessors to be the total taxable value of land and additions on the property. | Land | Improvement |
|---|---|---|---|---|
| 2024 | $1,573 | $187,200 | $26,300 | $160,900 |
| 2023 | $1,457 | $178,900 | $25,100 | $153,800 |
| 2022 | $1,495 | $171,100 | $23,600 | $147,500 |
| 2021 | $1,348 | $156,700 | $23,600 | $133,100 |
| 2020 | $1,555 | $172,800 | $23,600 | $149,200 |
| 2019 | $1,488 | $169,100 | $22,600 | $146,500 |
| 2018 | $1,483 | $165,200 | $22,600 | $142,600 |
| 2017 | $1,184 | $137,700 | $22,600 | $115,100 |
| 2016 | $1,116 | $132,900 | $22,600 | $110,300 |
| 2014 | $1,114 | $130,200 | $22,600 | $107,600 |
Source: Public Records
Map
Nearby Homes
- 228 Shaw St
- 303 Green St
- 329 Avon Ave
- 2394 Eagle Ave
- 2198 Galleone Way
- 7683 Fairwood Blvd
- 214 N Vine St
- 407 Dunn St
- 980 Andico Rd
- 2668 Marjorie Ln
- 800 Walton Dr
- 1042 W Main St
- 324 Holiday Dr
- 911 Gary Dr
- 1429 Blackthorne Trail N
- 1713 Sycamore Dr
- 1710 Beechwood Dr
- 4181 Baranga Dr
- 504 Magnolia Dr
- 4538 Redcliff South Ln
Your Personal Tour Guide
Ask me questions while you tour the home.