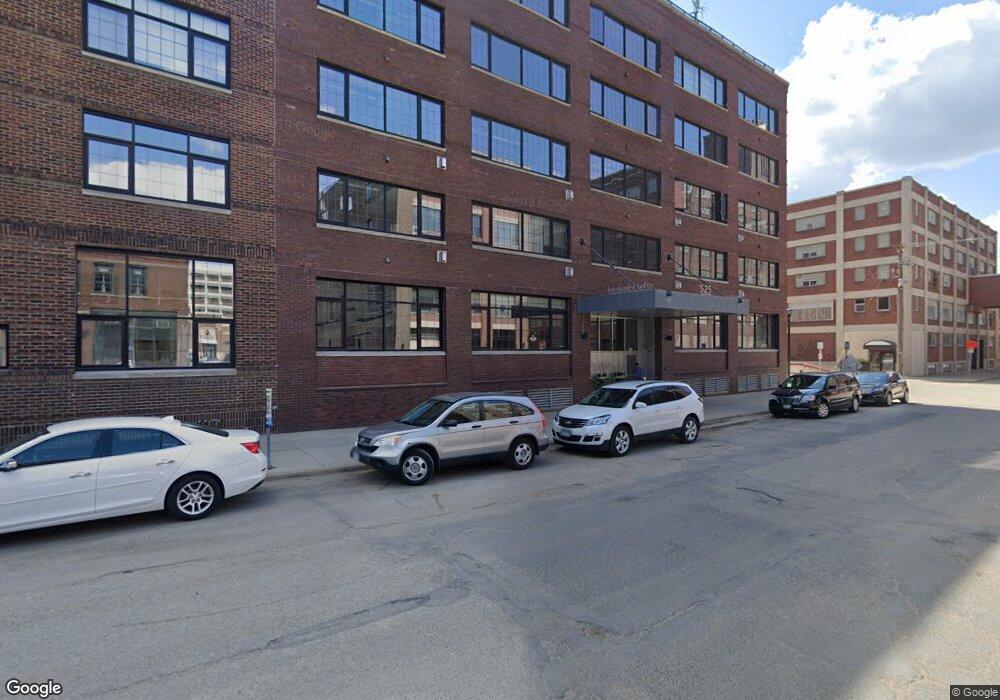
NOT LISTED FOR SALE

Estimated Value: $567,000 - $745,000

2 Beds
2 Baths
1,461 Sq Ft
$432/Sq Ft Est. Value

About This Home

This home is located at 525 N 3rd St Unit 402, Minneapolis, MN 55401 and is currently estimated at $631,003, approximately $431 per square foot. 525 N 3rd St Unit 402 is a home located in Hennepin County with nearby schools including Webster Elementary, Northeast Middle School, and Thomas Edison High School.

Ownership History

Date Name Owned For Owner Type

Purchase Details

Closed on
Oct 31, 2022
Sold by
Hanson Katherine A
Bought by
Hamburge Joanne P
Current Estimated Value
$631,003

Home Financials for this Owner

Home Financials are based on the most recent Mortgage that was taken out on this home.
Original Mortgage
$450,000
Outstanding Balance
$439,739
Interest Rate
7.25%
Mortgage Type
New Conventional
Estimated Equity
$191,264

Purchase Details

Closed on
Jul 26, 2017
Sold by
Tilton Scott and Tilton Katherine J
Bought by
Hanson Katherine A

Home Financials for this Owner

Home Financials are based on the most recent Mortgage that was taken out on this home.
Original Mortgage
$370,000
Interest Rate
3.91%
Mortgage Type
New Conventional

Purchase Details

Closed on
Nov 9, 2011
Sold by
Tilton Jacqueline M and Titlon Glenn F
Bought by
Tilton Scott and Tilton Katherine J

Purchase Details

Closed on
Aug 13, 2004
Sold by
Rex Ii Llc
Bought by
Tilton Scott and Tilton Jacqueline M
Source: Public Records

Range of Values:

Collateral Analytics

Collateral Analytics Collateral Analytics AVMs (Automated Valuation Model) employ a number of statistical approaches combined with neighborhood-specific comparable selection guarantees the most up-to-date and precise valuations.

Not Available

Collateral Analytics does not have data for the current month. Please view the chart for historical values.

ICE

ICE Mortgage Technology ICE Mortgage Technology’s AVM (Automated Valuation Model) is a state-of-the-art online residential property valuation tool that provides a quick and accurate estimate of the value of almost any home in the U.S.

Not Available

ICE Mortgage Technology does not have data for the current month. Please view the chart for historical values.

First American

First American First American Data & Analytics’ next-generation AVM combines unrivaled data assets with a blended ensemble of valuation models to produce highly accurate, reliable valuations you can trust.

Not Available

First American does not have data for the current month. Please view the chart for historical values.

Quantarium

Quantarium Quantarium’s valuation service, repeatedly proven the industry’s most accurate and comprehensive, is supercharged with a self-learning and auto-tuning AI engine that continually becomes smarter and more accurate as it processes daily inputs from the industry’s leading RE data lake.

Not Available

Quantarium does not have data for the current month. Please view the chart for historical values.

Average Value
Not Available
List Price
Sold Price
Create a Home Valuation Report for This Property
The Home Valuation Report is an in-depth analysis detailing your home's value as well as a comparison with similar homes in the area

Home Values in the Area

Source: Public Records

Average Home Value in this Area


Source: Public Records

Purchase History

Date Buyer Sale Price Title Company
Hamburge Joanne P $600,000 Partners Title
Hanson Katherine A $560,000 Edina Realty Title Inc
Tilton Scott -- None Available
Tilton Scott $389,900 --
Source: Public Records

Mortgage History

Date Status Borrower Loan Amount
Open Hamburge Joanne P $450,000
Previous Owner Hanson Katherine A $370,000
Source: Public Records

Tax History Compared to Growth

Source: Public Records

Tax History

Year Tax Paid Tax Assessment Tax Assessment Total Assessment is a certain percentage of the fair market value that is determined by local assessors to be the total taxable value of land and additions on the property. Land Improvement
2023 $7,166 $540,000 $171,000 $369,000
2022 $7,601 $539,500 $159,000 $380,500
2021 $7,334 $539,500 $128,000 $411,500
2020 $7,760 $539,500 $36,600 $502,900
2019 $7,992 $529,000 $24,400 $504,600
2018 $7,361 $529,000 $24,400 $504,600
2017 $7,574 $490,000 $24,400 $465,600
2016 $6,640 $417,500 $24,400 $393,100
2015 $6,445 $386,000 $24,400 $361,600
2014 -- $321,500 $24,400 $297,100
Source: Public Records

Map