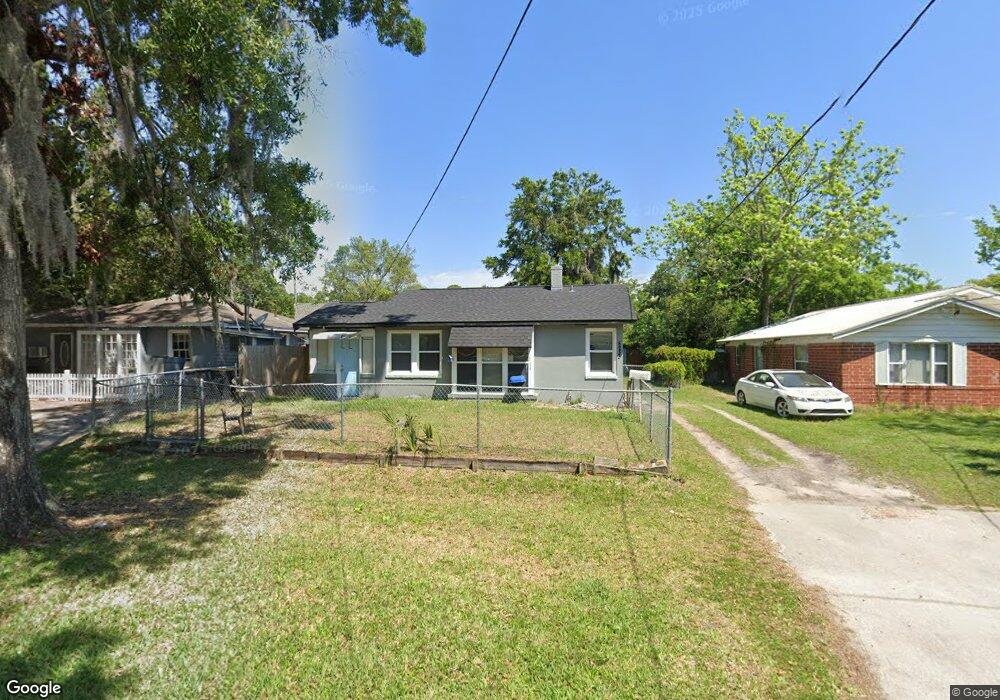
5253 Fremont St Jacksonville, FL 32210
Lakeshore NeighborhoodEstimated Value: $117,702 - $211,000
2
Beds
1
Bath
863
Sq Ft
$188/Sq Ft
Est. Value
About This Home
This home is located at 5253 Fremont St, Jacksonville, FL 32210 and is currently estimated at $162,176, approximately $187 per square foot. 5253 Fremont St is a home located in Duval County with nearby schools including Bayview Elementary School, Andros Karperos, and Lake Shore Middle School.
Ownership History
Date
Name
Owned For
Owner Type
Purchase Details
Closed on
Oct 7, 2021
Sold by
Tastad Christopher J
Bought by
Ryland Homes Llc
Current Estimated Value
Home Financials for this Owner
Home Financials are based on the most recent Mortgage that was taken out on this home.
Original Mortgage
$3,300
Outstanding Balance
$3,020
Interest Rate
3.05%
Mortgage Type
Construction
Estimated Equity
$159,156
Purchase Details
Closed on
Oct 31, 2003
Sold by
Lilly Gary A and Neumiller Katherine E
Bought by
Tastad Christopher J
Home Financials for this Owner
Home Financials are based on the most recent Mortgage that was taken out on this home.
Original Mortgage
$63,240
Interest Rate
5.98%
Mortgage Type
VA
Purchase Details
Closed on
May 21, 1997
Sold by
Hill Devon P and Hill Lynda S
Bought by
Lilly Gary A and Lilly Katherine E
Purchase Details
Closed on
Jan 24, 1994
Sold by
Turcotte Nancy A
Bought by
Hill Devon P
Create a Home Valuation Report for This Property
The Home Valuation Report is an in-depth analysis detailing your home's value as well as a comparison with similar homes in the area
Home Values in the Area
Average Home Value in this Area
Purchase History
| Date | Buyer | Sale Price | Title Company |
|---|---|---|---|
| Ryland Homes Llc | $66,500 | Advantage Title | |
| Tastad Christopher J | $62,000 | Gulf Coast Title Closings & | |
| Lilly Gary A | $38,000 | -- | |
| Hill Devon P | -- | -- |
Source: Public Records
Mortgage History
| Date | Status | Borrower | Loan Amount |
|---|---|---|---|
| Open | Ryland Homes Llc | $3,300 | |
| Previous Owner | Tastad Christopher J | $63,240 |
Source: Public Records
Tax History Compared to Growth
Tax History
| Year | Tax Paid | Tax Assessment Tax Assessment Total Assessment is a certain percentage of the fair market value that is determined by local assessors to be the total taxable value of land and additions on the property. | Land | Improvement |
|---|---|---|---|---|
| 2025 | $1,431 | $69,429 | $33,600 | $35,829 |
| 2024 | $1,432 | $69,919 | $33,600 | $36,319 |
| 2023 | $1,432 | $70,633 | $33,600 | $37,033 |
| 2022 | $1,251 | $62,799 | $30,000 | $32,799 |
| 2021 | $1,478 | $78,376 | $24,000 | $54,376 |
| 2020 | $1,409 | $77,024 | $24,000 | $53,024 |
| 2019 | $1,357 | $76,876 | $24,000 | $52,876 |
| 2018 | $1,200 | $60,134 | $13,200 | $46,934 |
| 2017 | $1,141 | $58,077 | $12,000 | $46,077 |
| 2016 | $1,057 | $50,697 | $0 | $0 |
| 2015 | $971 | $43,058 | $0 | $0 |
| 2014 | $893 | $37,242 | $0 | $0 |
Source: Public Records
Map
Nearby Homes
- 5316 Colonial Ave
- 5315 Colonial Ave
- 5246 Sunderland Rd
- 5332 Colonial Ave
- 5213 Birkenhead Rd
- 5146 Sunderland Rd
- 5202 Birkenhead Rd
- 5128 Sunderland Rd
- 2347 Lake Shore Blvd
- 5106 Appleton Ave
- 5133 Palmer Ave
- 5044 Colonial Ave
- 5044 Sunderland Rd
- 5026 Colonial Ave
- 5050 San Juan Ave
- 5331 Shirley Ave
- 4845 Sunderland Rd
- 3434 Blanding Blvd Unit 101
- 3434 Blanding Blvd Unit 124
- 3434 Blanding Blvd Unit 122
- 5247 Fremont St
- 5259 Fremont St
- 2147 Retaw St
- 5243 Fremont St
- 5256 Colonial Ave
- 5248 Colonial Ave
- 2150 Retaw St
- 5238 Colonial Ave
- 5276 Fremont St
- 5250 Fremont St
- 5246 Fremont St
- 5233 Fremont St
- 5242 Fremont St
- 5302 Colonial Ave
- 5303 Fremont St
- 5238 Fremont St
- 5232 Colonial Ave
- 5229 Fremont St
- 5302 Fremont St
- 5308 Colonial Ave