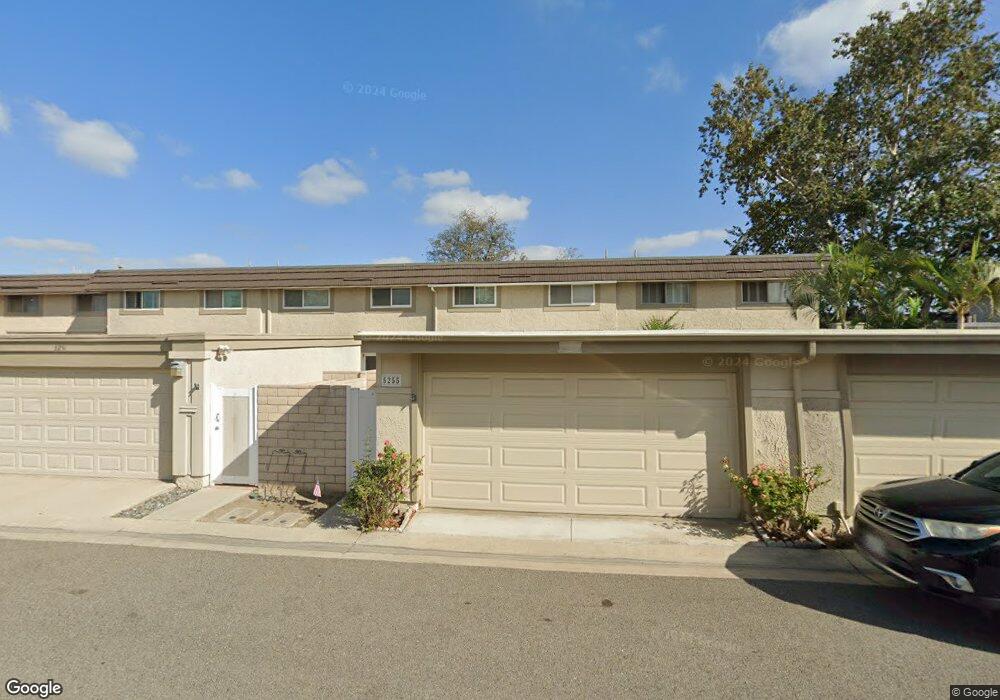
5255 Charing Cross Rd Westminster, CA 92683
Estimated Value: $795,000 - $900,000
2
Beds
2
Baths
1,350
Sq Ft
$618/Sq Ft
Est. Value
About This Home
This home is located at 5255 Charing Cross Rd, Westminster, CA 92683 and is currently estimated at $834,581, approximately $618 per square foot. 5255 Charing Cross Rd is a home located in Orange County with nearby schools including Eastwood Elementary School, Helen Stacey Intermediate School, and Westminster High School.
Ownership History
Date
Name
Owned For
Owner Type
Purchase Details
Closed on
Mar 16, 2004
Sold by
Dipaolo Lucia L and Dipaolo Lucia Labrador
Bought by
Dipaolo Lucia L and The Lucia L Dipaolo Revocable Trust
Current Estimated Value
Purchase Details
Closed on
Jun 5, 2000
Sold by
Lambertus Vanvelden and Lambertus Elke
Bought by
Dipaolo Lucia Labrador
Home Financials for this Owner
Home Financials are based on the most recent Mortgage that was taken out on this home.
Original Mortgage
$162,500
Outstanding Balance
$57,492
Interest Rate
8.27%
Mortgage Type
Stand Alone First
Estimated Equity
$777,089
Purchase Details
Closed on
Apr 7, 1994
Sold by
Yamamoto Kathryn S
Bought by
Vanvelden Lambertus and Vanvelden Elke
Home Financials for this Owner
Home Financials are based on the most recent Mortgage that was taken out on this home.
Original Mortgage
$131,200
Interest Rate
7.87%
Create a Home Valuation Report for This Property
The Home Valuation Report is an in-depth analysis detailing your home's value as well as a comparison with similar homes in the area
Home Values in the Area
Average Home Value in this Area
Purchase History
| Date | Buyer | Sale Price | Title Company |
|---|---|---|---|
| Dipaolo Lucia L | -- | -- | |
| Dipaolo Lucia Labrador | $210,000 | American Title Co | |
| Vanvelden Lambertus | $164,000 | Orange Coast Title Company |
Source: Public Records
Mortgage History
| Date | Status | Borrower | Loan Amount |
|---|---|---|---|
| Open | Dipaolo Lucia Labrador | $162,500 | |
| Previous Owner | Vanvelden Lambertus | $131,200 |
Source: Public Records
Tax History Compared to Growth
Tax History
| Year | Tax Paid | Tax Assessment Tax Assessment Total Assessment is a certain percentage of the fair market value that is determined by local assessors to be the total taxable value of land and additions on the property. | Land | Improvement |
|---|---|---|---|---|
| 2025 | $4,136 | $322,753 | $196,379 | $126,374 |
| 2024 | $4,136 | $316,425 | $192,528 | $123,897 |
| 2023 | $3,995 | $310,221 | $188,753 | $121,468 |
| 2022 | $3,929 | $304,139 | $185,052 | $119,087 |
| 2021 | $3,826 | $298,176 | $181,424 | $116,752 |
| 2020 | $3,783 | $295,119 | $179,564 | $115,555 |
| 2019 | $3,742 | $289,333 | $176,043 | $113,290 |
| 2018 | $3,739 | $283,660 | $172,591 | $111,069 |
| 2017 | $3,606 | $278,099 | $169,207 | $108,892 |
| 2016 | $3,499 | $272,647 | $165,890 | $106,757 |
| 2015 | $3,442 | $268,552 | $163,398 | $105,154 |
| 2014 | $3,367 | $263,292 | $160,197 | $103,095 |
Source: Public Records
Map
Nearby Homes
- 14422 Birmingham Dr
- 5102 Piccadilly Cir
- 5056 Hampton Ct
- 14182 Elystan Cir
- 14116 Baker St
- 14208 Graham St
- 5521 Dollar Dr
- 5781 Westmoreland Cir
- 5872 Camphor Ave
- 5932 Chinook Dr
- 13722 Hammon Place
- 13731 Springdale St
- 13392 Anawood Way
- 5302 Clark Cir
- 6022 Larchwood Dr
- 6101 Jade Cir
- 14621 Chalet Ln
- 13562 Springdale St
- 14862 Sabre Ln
- 6311 Wisteria Dr
- 5251 Charing Cross Rd
- 5261 Charing Cross Rd
- 5245 Charing Cross Rd
- 5271 Charing Cross Rd
- 5241 Charing Cross Rd
- 5235 Charing Cross Rd
- 5281 Charing Cross Rd
- 5256 Charing Cross Rd
- 5252 Charing Cross Rd
- 5262 Charing Cross Rd
- 5231 Charing Cross Rd
- 5246 Charing Cross Rd
- 5272 Charing Cross Rd
- 5285 Charing Cross Rd
- 5242 Charing Cross Rd
- 5261 Tufton St
- 5276 Charing Cross Rd
- 5225 Charing Cross Rd
- 5236 Charing Cross Rd
- 5265 Tufton St