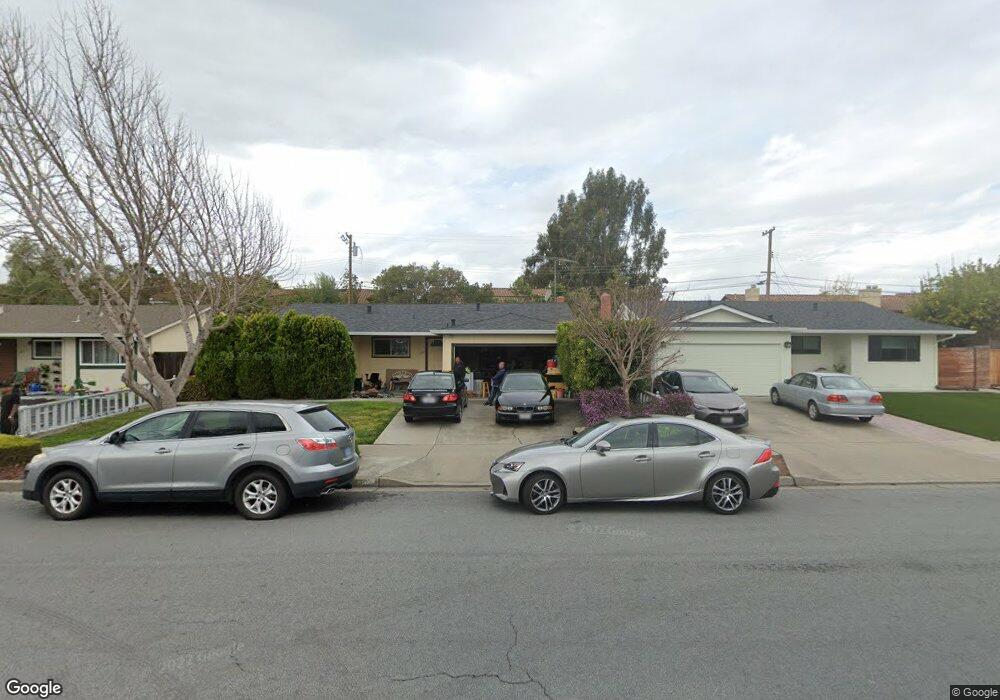
526 Arbor Way Milpitas, CA 95035
Estimated Value: $654,477 - $1,338,000
2
Beds
2
Baths
924
Sq Ft
$917/Sq Ft
Est. Value
About This Home
This home is located at 526 Arbor Way, Milpitas, CA 95035 and is currently estimated at $847,119, approximately $916 per square foot. 526 Arbor Way is a home located in Santa Clara County with nearby schools including Marshall Pomeroy Elementary School, Thomas Russell Middle School, and Milpitas High School.
Ownership History
Date
Name
Owned For
Owner Type
Purchase Details
Closed on
Dec 20, 2021
Sold by
Maxwell Martin G
Bought by
Maxwell Martin G and Nguyen Trang Thi
Current Estimated Value
Purchase Details
Closed on
Jul 10, 2017
Sold by
Maxwell Martin G and Nguyen Trang Thi Huyen
Bought by
Maxwell Martin G
Home Financials for this Owner
Home Financials are based on the most recent Mortgage that was taken out on this home.
Original Mortgage
$259,000
Outstanding Balance
$215,480
Interest Rate
3.94%
Mortgage Type
New Conventional
Estimated Equity
$631,639
Purchase Details
Closed on
Sep 20, 1994
Sold by
Wilson Development Inc
Bought by
Maxwell Martin G
Home Financials for this Owner
Home Financials are based on the most recent Mortgage that was taken out on this home.
Original Mortgage
$154,989
Interest Rate
8.61%
Mortgage Type
Assumption
Create a Home Valuation Report for This Property
The Home Valuation Report is an in-depth analysis detailing your home's value as well as a comparison with similar homes in the area
Home Values in the Area
Average Home Value in this Area
Purchase History
| Date | Buyer | Sale Price | Title Company |
|---|---|---|---|
| Maxwell Martin G | -- | None Available | |
| Maxwell Martin G | -- | Nextitle | |
| Maxwell Martin G | $158,000 | First American Title Guarant |
Source: Public Records
Mortgage History
| Date | Status | Borrower | Loan Amount |
|---|---|---|---|
| Open | Maxwell Martin G | $259,000 | |
| Closed | Maxwell Martin G | $154,989 |
Source: Public Records
Tax History
| Year | Tax Paid | Tax Assessment Tax Assessment Total Assessment is a certain percentage of the fair market value that is determined by local assessors to be the total taxable value of land and additions on the property. | Land | Improvement |
|---|---|---|---|---|
| 2025 | $3,119 | $265,275 | $125,962 | $139,313 |
| 2024 | $3,119 | $260,075 | $123,493 | $136,582 |
| 2023 | $3,108 | $254,976 | $121,072 | $133,904 |
| 2022 | $3,181 | $249,978 | $118,699 | $131,279 |
| 2021 | $3,054 | $245,077 | $116,372 | $128,705 |
| 2020 | $3,002 | $242,565 | $115,179 | $127,386 |
| 2019 | $2,969 | $237,810 | $112,921 | $124,889 |
| 2018 | $2,825 | $233,148 | $110,707 | $122,441 |
| 2017 | $2,789 | $228,578 | $108,537 | $120,041 |
| 2016 | $2,672 | $224,097 | $106,409 | $117,688 |
| 2015 | $2,645 | $220,732 | $104,811 | $115,921 |
| 2014 | $2,561 | $216,409 | $102,758 | $113,651 |
Source: Public Records
Map
Nearby Homes
- 120 Dixon Landing Rd Unit 147
- 120 Dixon Landing Rd Unit 9
- 390 Valmy St
- 1637 Roger St
- 60 Jacklin Place
- 1279 Milkweed St
- 60 Wilson Way Unit 104
- 60 Wilson Way Unit 150
- 60 Wilson Way Unit 55
- 1597 Hidden Creek Ln
- 1200 N Abbott Ave Unit 200
- 1357 California Cir
- 1363 Lilac Way
- 622 Chamise Way
- 1357 Lilac Way
- 1359 Lilac Way
- 1361 Lilac Way
- 1355 Lilac Way
- 48962 Woodgrove Common Unit 143
- 1359 California Cir
- 525 Arbor Way
- 528 Arbor Way
- 527 Arbor Way
- 623 Arbor Way
- 624 Arbor Way
- 430 Arbor Way
- 429 Arbor Way
- 622 Arbor Way
- 621 Arbor Way Unit 21
- 432 Arbor Way Unit 32
- 431 Arbor Way
- 68 Washington Square Dr
- 620 Arbor Way
- 619 Arbor Way Unit 19
- 70 Washington Square Dr
- 434 Arbor Way Unit 34
- 433 Arbor Way
- 64 Washington Square Dr
- 66 Washington Square Dr
- 1423 Fontainbleu Ave
Your Personal Tour Guide
Ask me questions while you tour the home.