
Seller's Agent in 2023
Mary Curran
Compass
(707) 364-6297
19 in this area
30 Total Sales
Estimated Value: $1,136,000 - $1,310,457
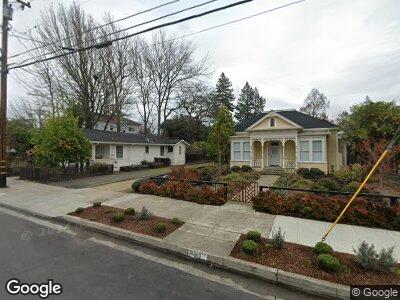
This home is located at 526 Fitch St, Healdsburg, CA 95448 and is currently estimated at $1,236,114, approximately $1,175 per square foot. 526 Fitch St is a home located in Sonoma County with nearby schools including Healdsburg Elementary School, Healdsburg Junior High School, and Healdsburg High School.
| Date | Buyer | Sale Price | Title Company |
|---|---|---|---|
| 5 Gh Property Holdings Llc | $1,325,000 | Cornerstone Title | |
| Luu Tessa | $795,000 | North Coast Title Co | |
| Wernig Ronald F | -- | None Available | |
| Wernig Ronald | $525,000 | Fidelity National Title Co | |
| Dekay George H | $300,000 | Fidelity National Title Co | |
| Burg Robert | -- | None Available |
| Date | Status | Borrower | Loan Amount |
|---|---|---|---|
| Previous Owner | Luu Tessa | $595,700 | |
| Previous Owner | Wernig Ronald | $400,000 | |
| Previous Owner | Werig Ronald | $401,500 | |
| Previous Owner | Wernig Ronald | $408,000 | |
| Previous Owner | Wernig Ronald | $417,000 | |
| Previous Owner | Dekay George H | $100,000 |
| Date | Event | Price | Change | Sq Ft Price |
|---|---|---|---|---|
| 07/14/2023 07/14/23 | Rented | $5,500 | 0.0% | -- |
| 07/11/2023 07/11/23 | Sold | $1,325,000 | 0.0% | $1,260 / Sq Ft |
| 07/10/2023 07/10/23 | Pending | -- | -- | -- |
| 07/10/2023 07/10/23 | Under Contract | -- | -- | -- |
| 07/10/2023 07/10/23 | For Sale | $1,325,000 | 0.0% | $1,260 / Sq Ft |
| 07/01/2023 07/01/23 | For Rent | $5,500 | 0.0% | -- |
| 06/03/2022 06/03/22 | Sold | $1,100,000 | +2.3% | $1,046 / Sq Ft |
| 05/18/2022 05/18/22 | Pending | -- | -- | -- |
| 03/28/2022 03/28/22 | For Sale | $1,075,000 | +35.2% | $1,022 / Sq Ft |
| 10/31/2017 10/31/17 | Sold | $795,000 | 0.0% | $723 / Sq Ft |
| 10/19/2017 10/19/17 | Pending | -- | -- | -- |
| 07/20/2017 07/20/17 | For Sale | $795,000 | -- | $723 / Sq Ft |
| Year | Tax Paid | Tax Assessment Tax Assessment Total Assessment is a certain percentage of the fair market value that is determined by local assessors to be the total taxable value of land and additions on the property. | Land | Improvement |
|---|---|---|---|---|
| 2023 | $15,313 | $1,122,000 | $448,800 | $673,200 |
| 2022 | $10,036 | $852,398 | $340,959 | $511,439 |
| 2021 | $9,943 | $835,685 | $334,274 | $501,411 |
| 2020 | $9,843 | $827,117 | $330,847 | $496,270 |
| 2019 | $9,637 | $810,900 | $324,360 | $486,540 |
| 2018 | $9,450 | $795,000 | $318,000 | $477,000 |
| 2017 | $6,858 | $582,523 | $210,816 | $371,707 |
| 2016 | $6,487 | $571,102 | $206,683 | $364,419 |
| 2015 | $5,731 | $505,000 | $183,000 | $322,000 |
| 2014 | $5,654 | $490,000 | $177,000 | $313,000 |
Seller's Agent in 2023
Mary Curran
Compass
(707) 364-6297
19 in this area
30 Total Sales
J
Seller's Agent in 2023
Jordan Oedewaldt
Vanguard Properties
(619) 971-6507
1 in this area
3 Total Sales
Buyer's Agent in 2023
Gary Sumner
Coldwell Banker Realty
(707) 535-8732
7 in this area
42 Total Sales
Seller's Agent in 2022
Sue Michaelsen
KM Properties
(707) 537-8989
1 in this area
16 Total Sales
Seller's Agent in 2017
Peter Shidler
Keller Williams Realty
(707) 978-3500
27 Total Sales