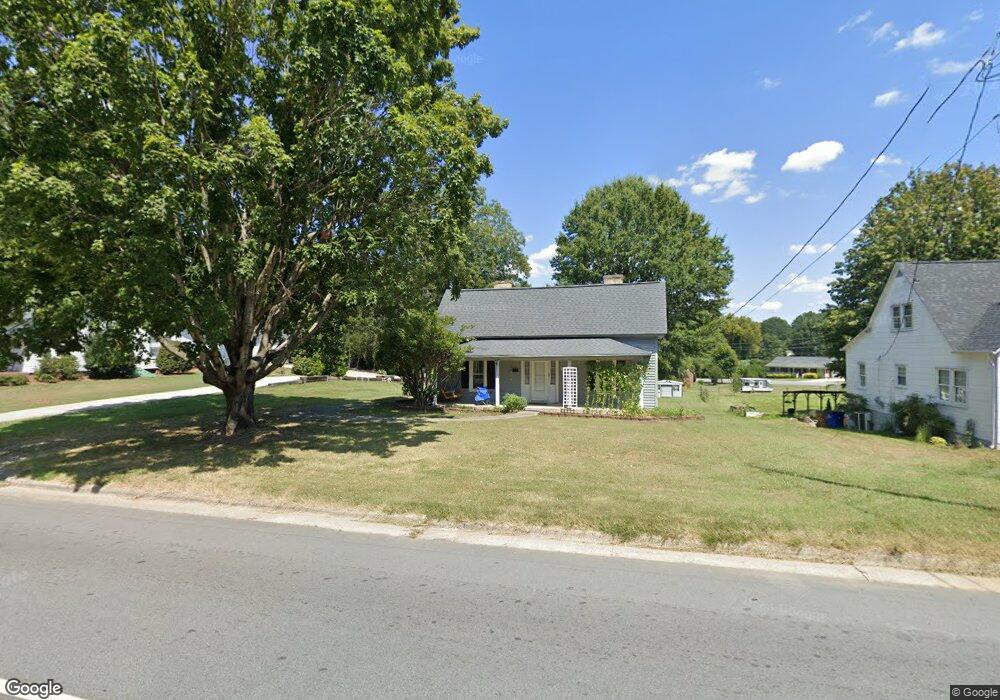
526 N Grove St Lincolnton, NC 28092
Estimated Value: $216,988 - $250,000
2
Beds
2
Baths
1,424
Sq Ft
$159/Sq Ft
Est. Value
About This Home
This home is located at 526 N Grove St, Lincolnton, NC 28092 and is currently estimated at $226,997, approximately $159 per square foot. 526 N Grove St is a home located in Lincoln County with nearby schools including Battleground Elementary School, Lincolnton Middle School, and Lincolnton High School.
Ownership History
Date
Name
Owned For
Owner Type
Purchase Details
Closed on
Jun 13, 2016
Sold by
Finger James R and Finger Gail B
Bought by
Gambill Kathy G
Current Estimated Value
Home Financials for this Owner
Home Financials are based on the most recent Mortgage that was taken out on this home.
Original Mortgage
$92,544
Outstanding Balance
$73,870
Interest Rate
3.66%
Mortgage Type
New Conventional
Estimated Equity
$153,127
Create a Home Valuation Report for This Property
The Home Valuation Report is an in-depth analysis detailing your home's value as well as a comparison with similar homes in the area
Home Values in the Area
Average Home Value in this Area
Purchase History
| Date | Buyer | Sale Price | Title Company |
|---|---|---|---|
| Gambill Kathy G | $90,000 | None Available |
Source: Public Records
Mortgage History
| Date | Status | Borrower | Loan Amount |
|---|---|---|---|
| Open | Gambill Kathy G | $92,544 |
Source: Public Records
Tax History Compared to Growth
Tax History
| Year | Tax Paid | Tax Assessment Tax Assessment Total Assessment is a certain percentage of the fair market value that is determined by local assessors to be the total taxable value of land and additions on the property. | Land | Improvement |
|---|---|---|---|---|
| 2025 | $2,007 | $186,907 | $31,288 | $155,619 |
| 2024 | $1,987 | $186,907 | $31,288 | $155,619 |
| 2023 | $1,982 | $186,907 | $31,288 | $155,619 |
| 2022 | $1,282 | $98,950 | $21,192 | $77,758 |
| 2021 | $1,282 | $98,950 | $21,192 | $77,758 |
| 2020 | $1,147 | $98,950 | $21,192 | $77,758 |
| 2019 | $1,147 | $98,950 | $21,192 | $77,758 |
| 2018 | $1,023 | $78,710 | $17,980 | $60,730 |
| 2017 | $922 | $78,710 | $17,980 | $60,730 |
| 2016 | $922 | $78,710 | $17,980 | $60,730 |
| 2015 | $989 | $78,710 | $17,980 | $60,730 |
| 2014 | $1,153 | $92,421 | $19,947 | $72,474 |
Source: Public Records
Map
Nearby Homes
- 502 Forney Ave
- 327 Bonview Ave
- 535 Norman Fair Ave
- 524 Bonview Ave
- 801 N Grove St
- 411 W Sycamore St
- 316 N Government St
- 627 W Main St
- 317 S High St
- 668 Riverside Dr
- 423 N Cedar St
- 743 Lore Rd
- 665 S Grove St
- 681 S Grove St
- 689 S Grove St
- 697 S Grove St
- 815 N Laurel St
- 515 S Academy St
- 329 E Congress St
- 826 E Alexander St
- 522 N Grove St
- 602 N Grove St
- 525 N Grove St
- 529 N Grove St
- 610 N Grove St
- 519 N Grove St
- 516 N Grove St
- 515 N Grove St Unit 517
- 601 N Grove St
- 511 N Grove St
- 323 Linwood Dr
- 614 N Grove St
- 300 Linwood Dr
- 611 N Grove St
- 415 Louise Ave
- 502 N Grove St
- 222 Linwood Dr
- 321 Linwood Dr
- 132 Linwood Dr
- 416 Louise Ave