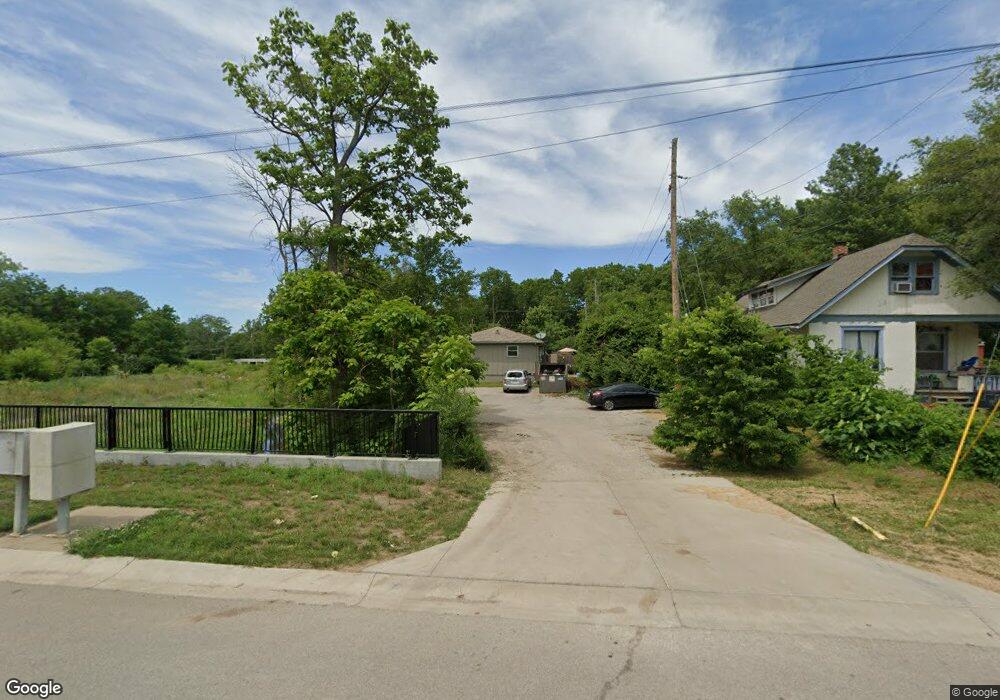
526 W Cedar St Olathe, KS 66061
Estimated Value: $222,000 - $265,000
4
Beds
2
Baths
1,152
Sq Ft
$207/Sq Ft
Est. Value
About This Home
This home is located at 526 W Cedar St, Olathe, KS 66061 and is currently estimated at $238,333, approximately $206 per square foot. 526 W Cedar St is a home located in Johnson County with nearby schools including Westview Elementary School, Oregon Trail Middle School, and Olathe West High School.
Ownership History
Date
Name
Owned For
Owner Type
Purchase Details
Closed on
Jul 26, 2018
Sold by
Amborn Albert C and Amborn Seletha E
Bought by
Enochs Richmond M and Colburn Enochs Tamara
Current Estimated Value
Purchase Details
Closed on
Apr 10, 2014
Sold by
Fannie Mae
Bought by
Shoehouse Investments Llc
Purchase Details
Closed on
Jun 8, 2006
Sold by
Klempnauer Alison J and Klempnauer Laura L
Bought by
Symes Dan and Symes Olivia
Purchase Details
Closed on
Jun 28, 2004
Sold by
Lieberman Benjamin H and Lieberman Cynthia
Bought by
Spalding Sean E
Purchase Details
Closed on
Jun 12, 2001
Sold by
King Arthur W
Bought by
Hallowell Charles Jeffrey and Hallowell Deborah L
Create a Home Valuation Report for This Property
The Home Valuation Report is an in-depth analysis detailing your home's value as well as a comparison with similar homes in the area
Home Values in the Area
Average Home Value in this Area
Purchase History
| Date | Buyer | Sale Price | Title Company |
|---|---|---|---|
| Enochs Richmond M | -- | Assured Quality Title Co | |
| Shoehouse Investments Llc | -- | Continental Title | |
| Symes Dan | -- | Continental Title Co | |
| Spalding Sean E | -- | Stewart Title Of Kansas City | |
| Stock Rhonda Kay | -- | Stewart Title | |
| Hallowell Charles Jeffrey | -- | Midwest Title Company |
Source: Public Records
Tax History
| Year | Tax Paid | Tax Assessment Tax Assessment Total Assessment is a certain percentage of the fair market value that is determined by local assessors to be the total taxable value of land and additions on the property. | Land | Improvement |
|---|---|---|---|---|
| 2025 | $1,733 | $18,342 | $5,675 | $12,667 |
| 2023 | $1,727 | $15,583 | $4,505 | $11,078 |
| 2022 | $1,538 | $13,547 | $4,095 | $9,452 |
| 2021 | $1,453 | $11,994 | $3,721 | $8,273 |
| 2020 | $1,382 | $11,316 | $3,382 | $7,934 |
| 2019 | $1,383 | $11,247 | $2,939 | $8,308 |
| 2018 | $1,299 | $10,511 | $2,671 | $7,840 |
| 2017 | $1,032 | $8,337 | $2,671 | $5,666 |
| 2016 | $988 | $8,199 | $2,671 | $5,528 |
| 2015 | $944 | $7,854 | $2,671 | $5,183 |
| 2013 | -- | $7,510 | $2,428 | $5,082 |
Source: Public Records
Map
Nearby Homes
- 573 W Loula St
- 600 W Elm St
- 316 W Elm St
- 601 S Troost St
- 629 S Sherman Ave
- 401 S Harrison St
- 513 S Water St
- 313 S Walker St
- 612 N Logan St
- 728 S Kansas Ave
- 430 E Loula St
- 811 S Cherry St
- 511 E Sheridan St
- 525 N Stevenson St
- 513 N Walker Ln
- 1529 W Park St
- 1528 W Romany Ct
- 4408 S Lane St
- 563 E Park St
- 625 N Stevenson St
Your Personal Tour Guide
Ask me questions while you tour the home.